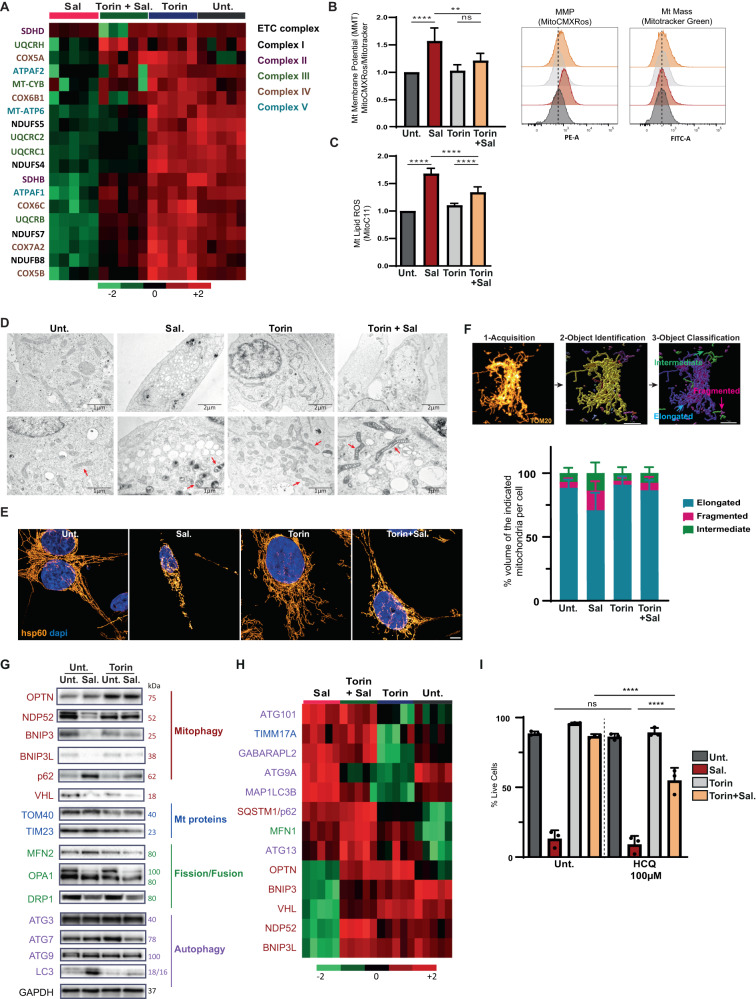
Fig. 5. mTOR inhibition prevents mitochondrial damages induced by Sal.
HMLER CD24L were treated with either Sal, Torin, or a combination of both for 48 h. A Heatmap of ETC proteins from proteomics data. Color key indicates protein expression value (green: lowest; red: highest). B Mitochondrial membrane potential was measured with MitoCMXRos and Mitotracker Green staining. Data are shown as a ratio of MitoCMXRos over Mitotracker Green (n = 5). C Mitochondrial lipid peroxidation was measured by Mito-C11 probe staining coupled with FC. Representative histogram of oxidized-Mito-C11 (FITC channel) intensity level in cells (n = 3). D TEM images, red arrows show mitochondria. E Immuno-staining of mitochondria with hsp60 and images acquired using Confocal Leica TCS SP5. Objective: 63×. Scale bar: 5 μm. F Upper panel, steps of the workflow developed to analysis mitochondrial network: first, a machine learning (ML) identified mitochondria as objects, then a second ML classified mitochondria into three classes depending on their shapes: fragmented, intermediary, and hyperfused. Scale bar: 7 μm. Lower panel, Quantification of mitochondrial network analysis, data shown as % area of each class for each cell. Analysis of>25 cells from 2 independent experiments. G Immunoblotting for the indicated autophagic/mitophagic proteins and Mt/dynamic proteins. GAPDH was used as the loading control. H Heatmap of autophagic/mitophagic proteins and Mt/dynamic proteins from proteomics data. Color key indicates metabolite expression value (green: lowest; red: highest). Protein terms and functions indicated with the same color are corresponding for (G) and (H). I HMLER CD24L cells were treated with Sal or/and Tor. in the presence or in the absence of HCQ (100 μM) for 144 h. Cell death was determined by dapi staining coupled with flow cytometry (FC). The graph represents the mean ( ± SEM) of three independent experiments. One-way ANOVA test. *p < 0.05; **p < 0.01; ***p < 0.001; ****p < 0.0001. ns, not significant.

