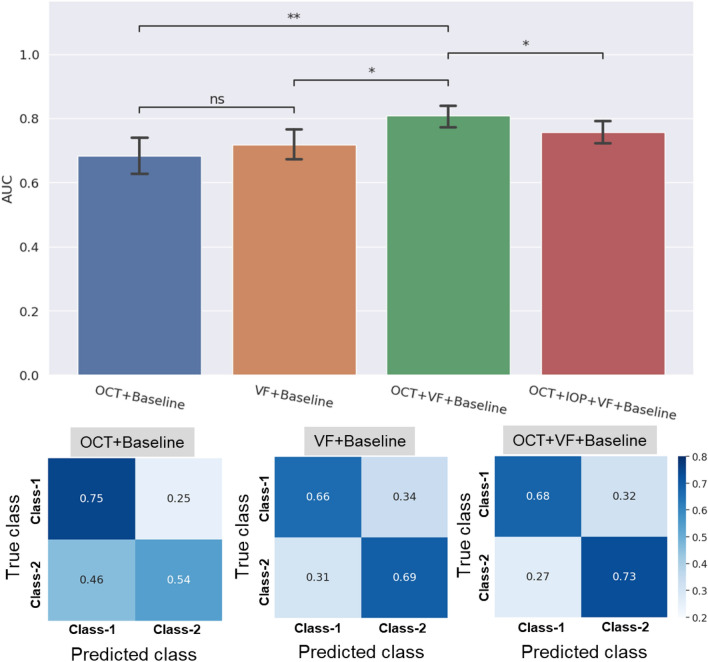
Figure 3.
Top panel shows the prediction AUCs obtained when baseline demographic and clinical data is used with only OCT images (blue), only VF MD values (orange), combined OCT and VF MD inputs (green), and OCT images combined with VF MD and longitudinal IOP values (red). Statistical annotations are as follows: **P value < 0.01, *P value < 0.05 and ns denotes “not statistically significant”. Confusion matrices shown in the bottom panel for three input combinations to the progression model suggest that the “OCT + VF + Baseline” input combination performs well for both Class-1 and Class-2 patients, correctly predicting 73% of the fast progressing cases (Class-2).

