
FIGURE 2.
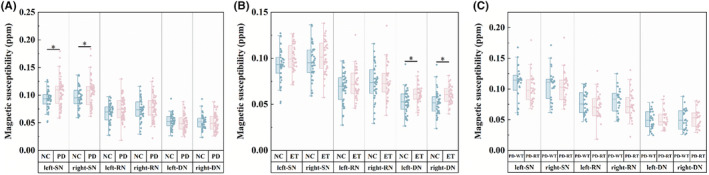
Intergroup differences in magnetic susceptibility in the SN and the nuclei of the DRT pathway using the GLM analysis: adjusted for age, sex, education, and MMSE scores in NC vs PD (A); adjusted for age and sex in PD‐RT vs PD‐WT (B), NC vs ET (C). Bonferroni correction was used for the intergroup comparisons and multiple comparisons. *Statistically significant differences (p < 0.0083). DRT pathway, dentato‐rubro‐thalamic pathway; GLM, general linear models; MMSE, the Mini‐Mental State Examination; DN, dentate nucleus; ET, essential tremor; NC, normal controls; PD‐RT, Parkinson's disease with rest tremor; PD‐WT, Parkinson's disease without rest tremor; RN, red nucleus; SN, substantia nigra.