FIGURE 1.

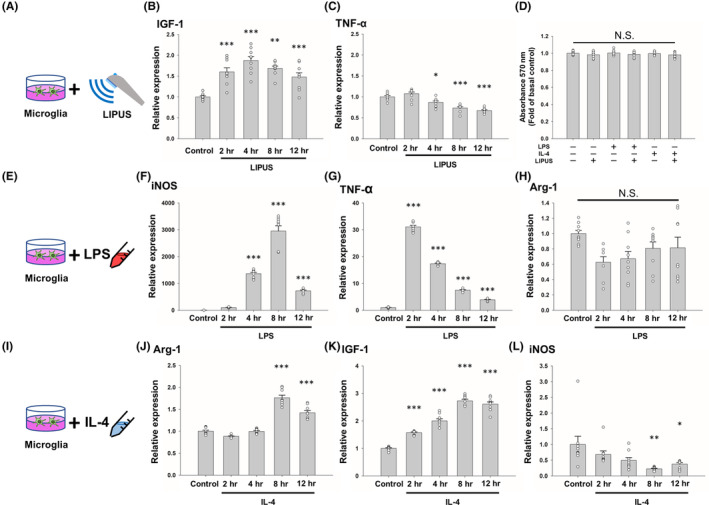
Effects of LIPUS, LPS, and IL‐4 treatment on the expression of M1‐ and M2‐related factors. (A) Microglial cells were treated with LIPUS. Cells were evaluated for (B) IGF‐1 and (C) TNF‐α mRNA expression at 2, 4, 8, and 12 h after LIPUS treatment. (D) No significant difference was found in the growth of microglia subjected to LIPUS, LPS, or IL‐4 treatment compared with the control group. (E) Microglial cells were treated with LPS and evaluated for (F) iNOS, (G) TNF‐α, and (H) Arg‐1 mRNA expression at 2, 4, 8, and 12 h after LPS treatment. (I) Microglial cells were treated with IL‐4 and evaluated for (J) Arg‐1, (K) IGF‐1, and (L) iNOS mRNA expression at 2, 4, 8, and 12 h after IL‐4 treatment. *denotes a significant difference between the control group and the other four groups. *p < 0.05; **p < 0.01; ***p < 0.001; N.S. = not significant; n = 9.
