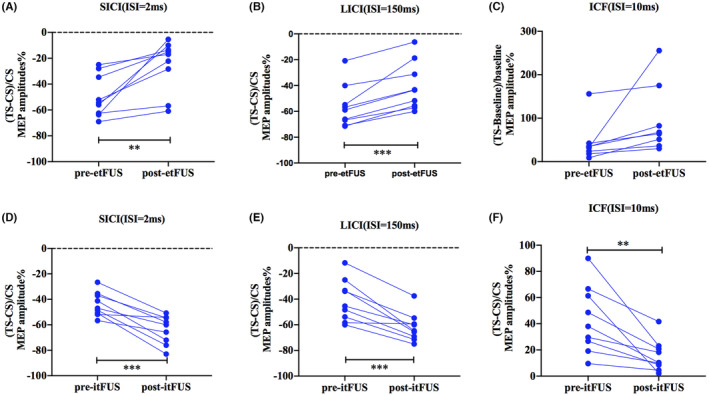
FIGURE 5.

The effect of tFUS on intracortical facilitation and inhibition. Intracortical excitability profiles before and after tFUS treatment were expressed as MEP change of TS relative to the CS. SICI, LICI, and ICF before and after etFUS (A–C) and itFUS (D–F) are shown. Values of >0 indicate facilitation, and values of <0 indicate inhibition. *Asterisk significant differences between before and after tFUS stimulation (paired t test, *p < 0.05, **p < 0.01, n = 9).
