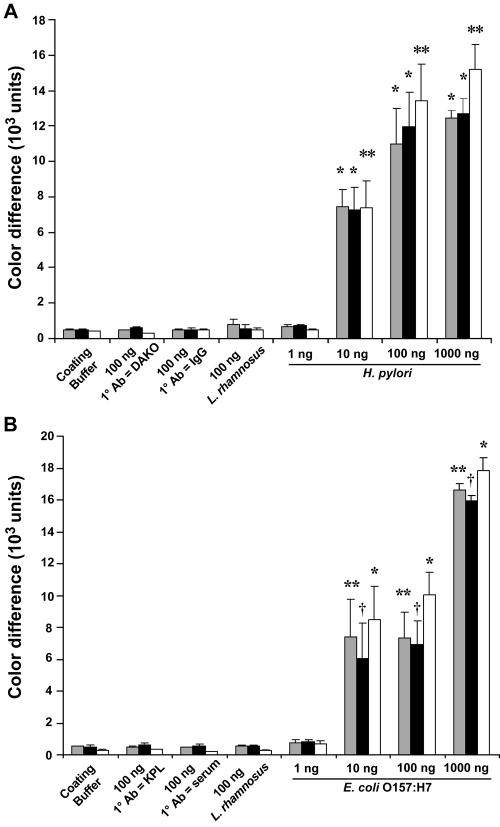
FIG. 4.
Quantification of RLS gold nanoparticle readout for the detection of H. pylori and E. coli O157:H7 antigens in PDMS microchannels. (A) Quantification of microchannel immunoassay for detection of H. pylori (Fig. 2A) by using the quantification software package; (B) quantification of microchannel immunoassay for detection of E. coli O157:H7 (Fig. 2B). Results are expressed as mean color differences ± standard error of the mean (n = 3). Gray bars, the results of quantification at the time of the initial experiments; black bars, quantification performed at 7 weeks after the initial experiments; open bars, quantification performed at 8 months of storage. There was a significant difference between H. pylori at a concentration of 10 to 1,000 ng and each of the negative controls (*, P < 0.001 at the time of the initial experiments and 7 weeks after the initial experiments; **, P < 0.01 at 8 months of storage [ANOVA]). Similarly, there was a statistically significant difference between E. coli O157:H7 at concentrations of 10 to 1,000 ng and each of the negative controls used (**, P < 0.01 at the time of the initial experiments; †, P < 0.05 at 7 weeks after the initial experiments; *, P < 0.001 at 8 months of storage [ANOVA]). 1° Ab, primary antibody; KPL, Kirkegaard & Perry Laboratories.

