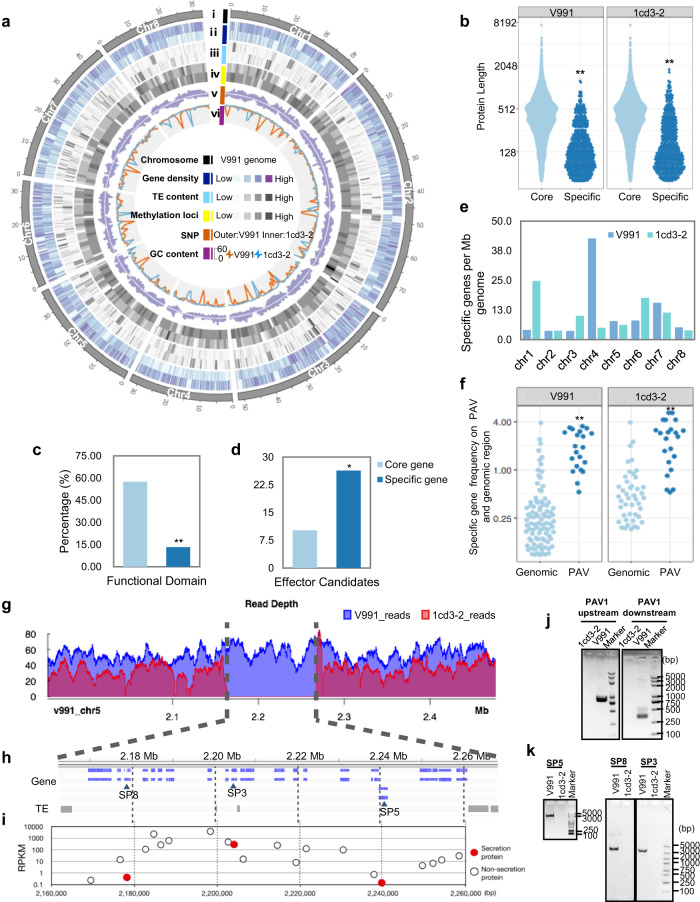
Fig. 1. Comparative genomics analysis of two fungal isolates reveals PAVs.
a Overview of the chromosomal features of V991 and 1cd3-2 with genetic and epigenetic data. i, Chromosomes of V991. ii, Gene density (bin=10 kb). Outer, V991; Inner, 1cd3-2. iii, TE content (bin=10 kb). iv, Methylation loci including 6 mA and 4mC (bin=100 kb). v, Distribution of SNPs (bin=100 kb). vi, GC content (bin=100 kb). Red line, V991; blue line, 1cd3-2. b Specific genes encoded smaller proteins with a significant P value < 2.2e-16 (Wilcox.test). c Specific genes were less likely to encode proteins with functional domains (own at least one Gene Ontology annotation). Statistical analyses were performed using Student’s t test: **P < 0.01. d Specific genes were more likely to encode candidate effectors (EffectorP classification). Statistical analyses were performed using Student’s t test: *P < 0.05. e Specific gene distribution in each chromosome. f In V991 and 1cd3-2, PAV regions had a higher frequency of specific genes than random genomic regions, with significant P values of 8.255e-12 and 8.839e-10, respectively (Wilcox test). g–i On chromosome 5, a large insertion incident (106 kb) affected 21 genes, including 20 specific genes, 3 of which encoded secreted proteins (SP3, SP5, SP8). g The PAV region was verified by PacBio sequence reads separately mapped to two genomes. h Gene and TE distribution in the PAV region. i Maximum gene regulation level for each gene from the upper panel. PCR validation of PAV regions (j) and specific genes (SP3, SP5, SP8) (k). j, k Experiments were repeated three times with similar results. Source data are provided as a Source Data file.

