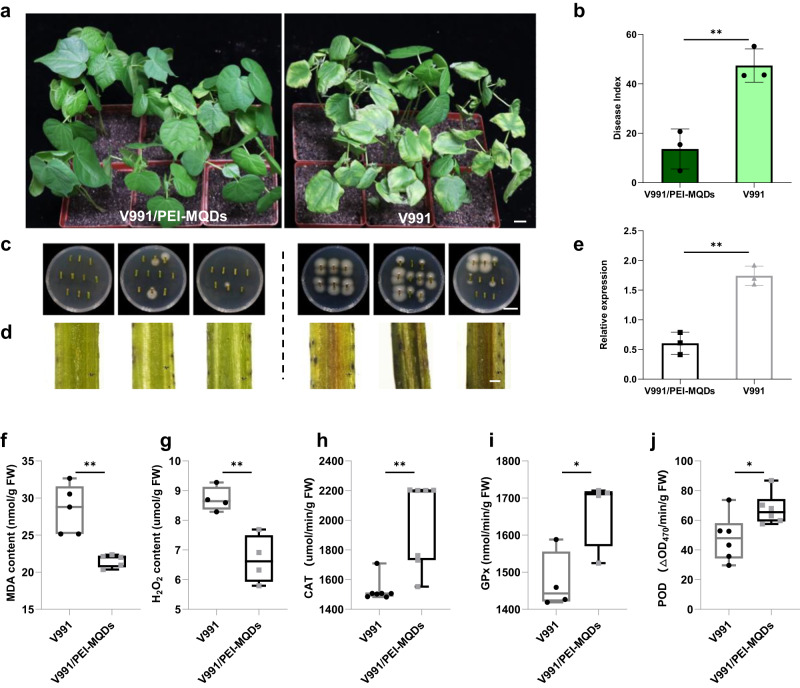
Fig. 5. PEI-MQDs improve cotton tolerance to V. dahliae by maintaining ROS homeostasis.
a Disease symptoms of cotton plants at 18 days after V991 inoculation with and without PEI-MQDs treatment. The scale bar represents 2 cm. b Disease index of infected cotton plants. c Fungal recovery assay. The scale bar represents 2 cm. d Sections from the cotyledonary node of cotton at 18 d after V. dahliae infection. The scale bar represents 100 μm. Experiments were repeated three times with similar results. e qPCR analysis of the amount of fungal DNA. GhUB7 was used as an internal reference, and the ITS of the fungal ribosomal DNA was targeted. In (b) and (e), values are the means ± s.d. for three biological replicates. Asterisks indicate statistically significant differences between the two groups (**P < 0.01, Student’s t test). Each dot represents individual data points. f–j PEI-MQDs reduced MDA and H2O2 content and increased catalase (CAT), glutathione peroxidase (GSH-Px) and peroxidase (POD) activities in the PEI-MQDs treated plants at 12 dpi. f MDA content. g H2O2 content. h CAT activity. i GPx activity. j POD activity. f–j Values are the means ± s.d. at least three biological replicates. n = 3, n shows independent experiments. Asterisks indicate statistically significant differences between the two groups (*P < 0.05, **P < 0.01, Student’s t test). In each box and whisker plot, the centerline is the median. The bottom and top edges of the boxes indicate the twenty-fifth and seventy-fifth percentiles. Each dot represents individual data points. Source data are provided as a Source Data file.

