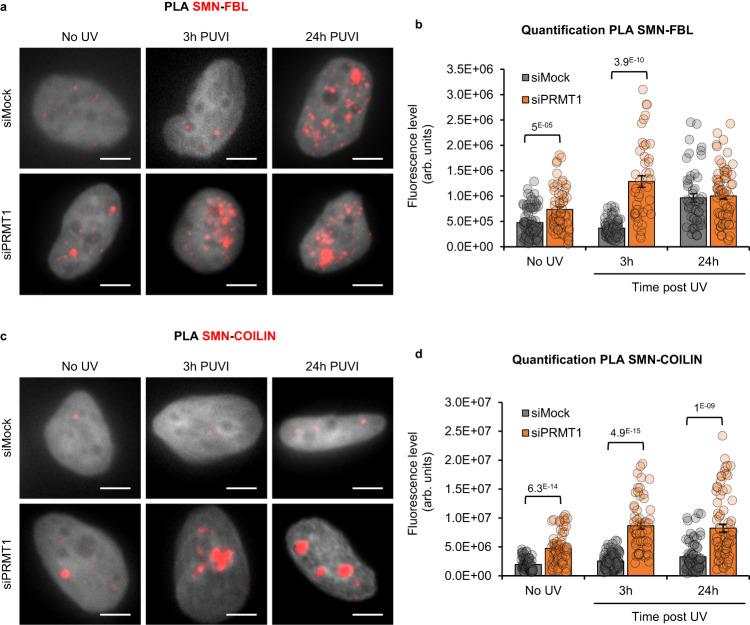
Fig. 7. PRMT1 remodels the interaction of SMN with FBL and COILIN.
a, c Representative microscopy images of Proximity Ligation Assay (PLA) in red showing the interaction (a) between SMN and FBL or (c) between SMN and COILIN at different times Post UV-Irradiation (PUVI) in cells transfected with siMock or siPRMT1 pool. Scale bar: 5 µm. DAPI in grey. b, d Quantification of fluorescent signal in the nucleus against the couple (b) SMN-FBL or (d) SMN-COILIN from PLA experiment in cells transfected with siMock or siPRMT1 pool after UV-C irradiation. Data are represented as mean values +/− SEM. At least 45 cells was quantified from one representative experiment. The p-value correspond to a student’s test with two-tailed distribution and two-sample unequal variance to compare siFBL with siMock. Source data of graphs are provided as a Source Data file.

