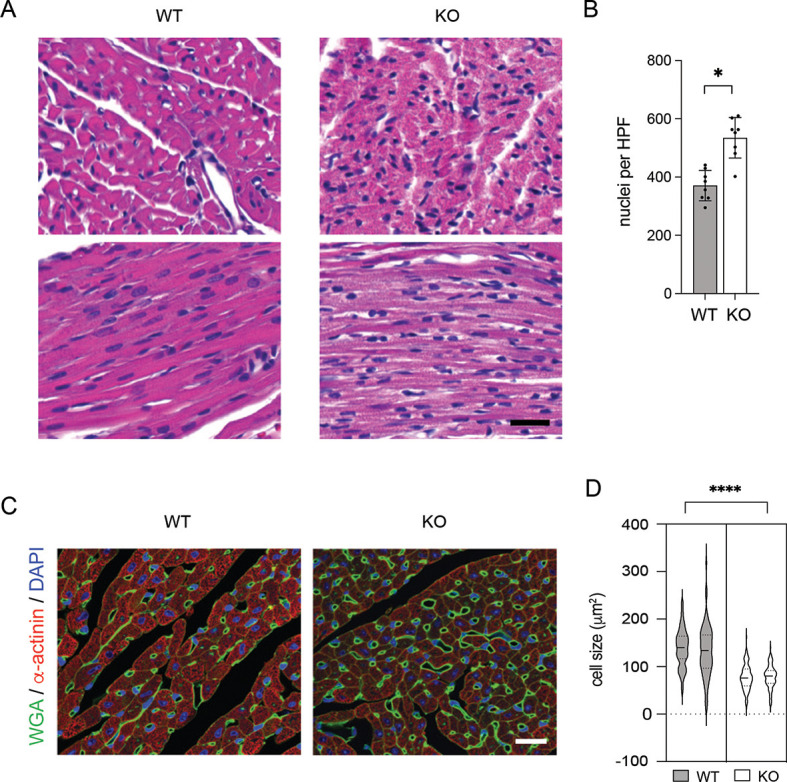
Fig. 2.

Myocardial hyperplasia in Ebf1 knockout mice. (A) High-magnification Hematoxylin and Eosin-stained images of the left ventricular free wall with cardiomyocytes in short axis (upper panels) and long axis (lower panels). (B) Quantitative image analysis of nuclei per high power field in Ebf1 wild-type and KO cardiomyocytes. (C) Immunofluorescence staining of wheat germ agglutinin (WGA), α-actinin and DAPI. (D) Violin plot of cell size distribution in Ebf1 wild-type and KO hearts. Each violin represents a separate heart. Scale bars: 20 mm. *P<0.05, ****P<0.001 (unpaired t-test). WT, wild type.
