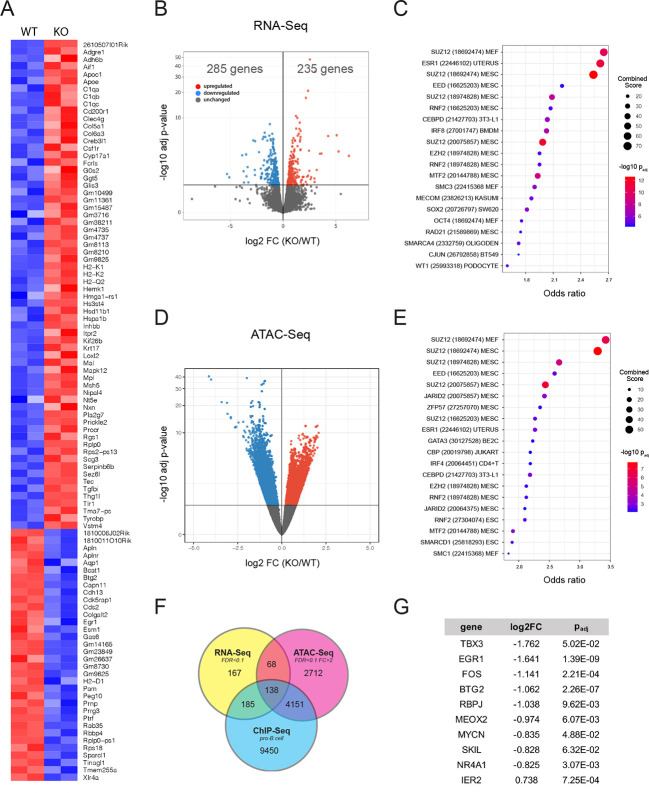
Fig. 7.
Gene profiling and chromatin analysis of embryonic Ebf1−/− non-myocytes. (A) Heatmap of the top 100 DEGs between E13.5 non-myocyte cells (NMCs) isolated from wild-type and KO hearts. (B) Volcano plot of DEGs. (C) Top 20 ChIP-Seq gene sets identified using ChEA3 analysis of DEGs. (D) Volcano plot of differentially accessible regions (DARs) identified by ATAC-Seq in wild-type and KO NMCs. (E) Top 20 ChIP-Seq gene sets identified using ChEA3 analysis of genes near DARs. (F) Venn diagram showing the genes shared between RNA-Seq identified DEGs and ATAC-Seq identified DARs in KO NMCs, and previously validated Ebf1 target genes. (G) Transcription factors shared between RNA-Seq, ATAC-Seq and ChIP-Seq analyses, along with relative expression in knockout cells and statistical significance.

