Fig. 5.
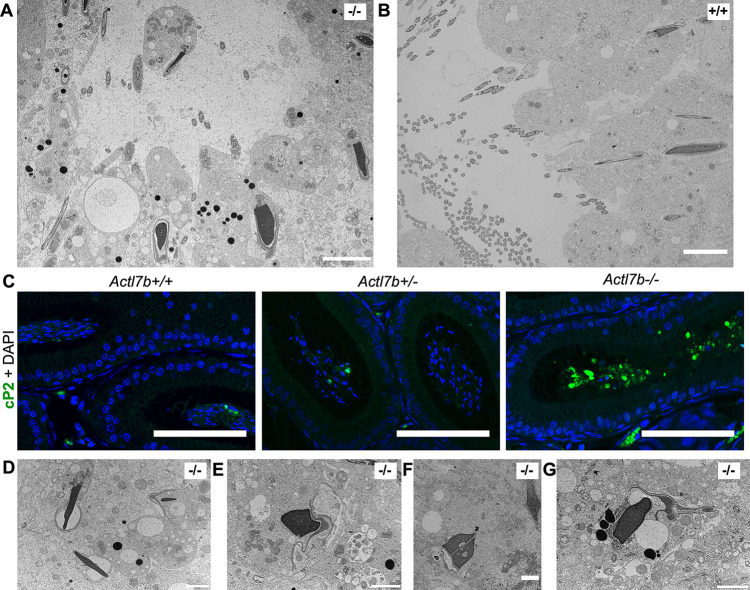
Ultrastructural analysis of Actl7b−/− testis. (A) Transmission electron micrograph of a lumen of an Actl7b−/− seminiferous tubule. Scale bar: 5 µm. (B) Transmission electron micrograph of a lumen of an Actl7b+/+ seminiferous tubule. Scale bar: 5 µm. (C) Immunohistochemistry against cP2 on caput sections from Actl7b+/+, Actl7b+/− and Actl7b−/− mice. DAPI was used as a counterstain. Scale bars: 100 µm. (D-G) Images of representative Actl7b−/− spermatids with condensed nuclei. Scale bars: 2 µm.

