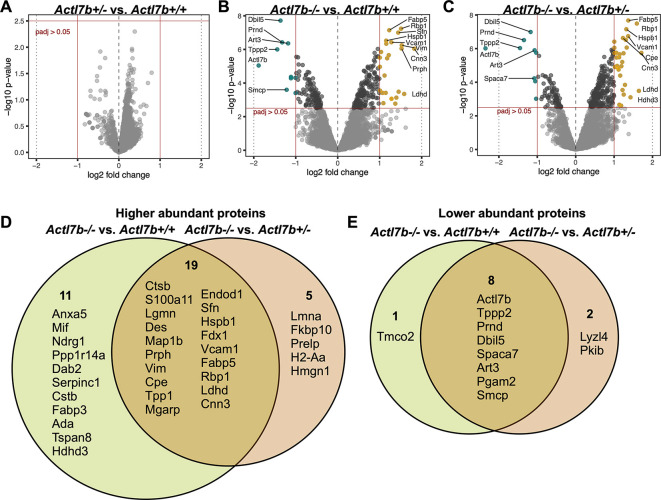
Fig. 8.
Proteomic analysis of Actl7b-deficient testis. (A-C) Volcano plots showing differential abundance (DA) of proteins in Actl7b+/− compared with Actl7b+/+ (A), in Actl7b−/− compared with Actl7b+/− (B) and in Actl7b−/− compared with Actl7b+/+ (C) testis. Proteins showing a significant DA are indicated in teal (less abundant) and yellow (more abundant) (adjusted P-value>0.05). Top DA proteins are labeled with their corresponding gene symbol. (D,E) Venn diagrams showing the overlap of significantly higher (D) and lower (E) abundance proteins in the comparisons of Actl7b−/− with Actl7b+/+, and Actl7b−/− with Actl7b+/+ testis (adjusted P-value≤0.05, LFC≤1).

