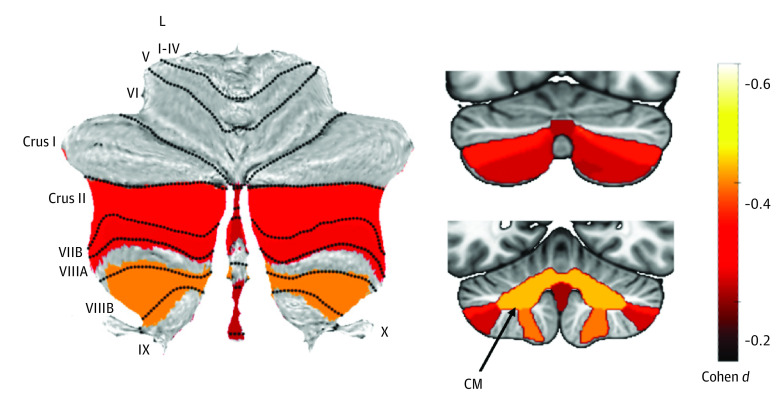
Figure 1. Primary Group Comparison.
Atlas-based effect size (Cohen d) maps and Montreal Neurological Institute-based coronal slices (top, y-axis = −72; bottom, y = −54) of the significant between-group differences for children with mild complicated severe traumatic brain injury vs controls. CM indicates corpus medullare; L, lobule.

