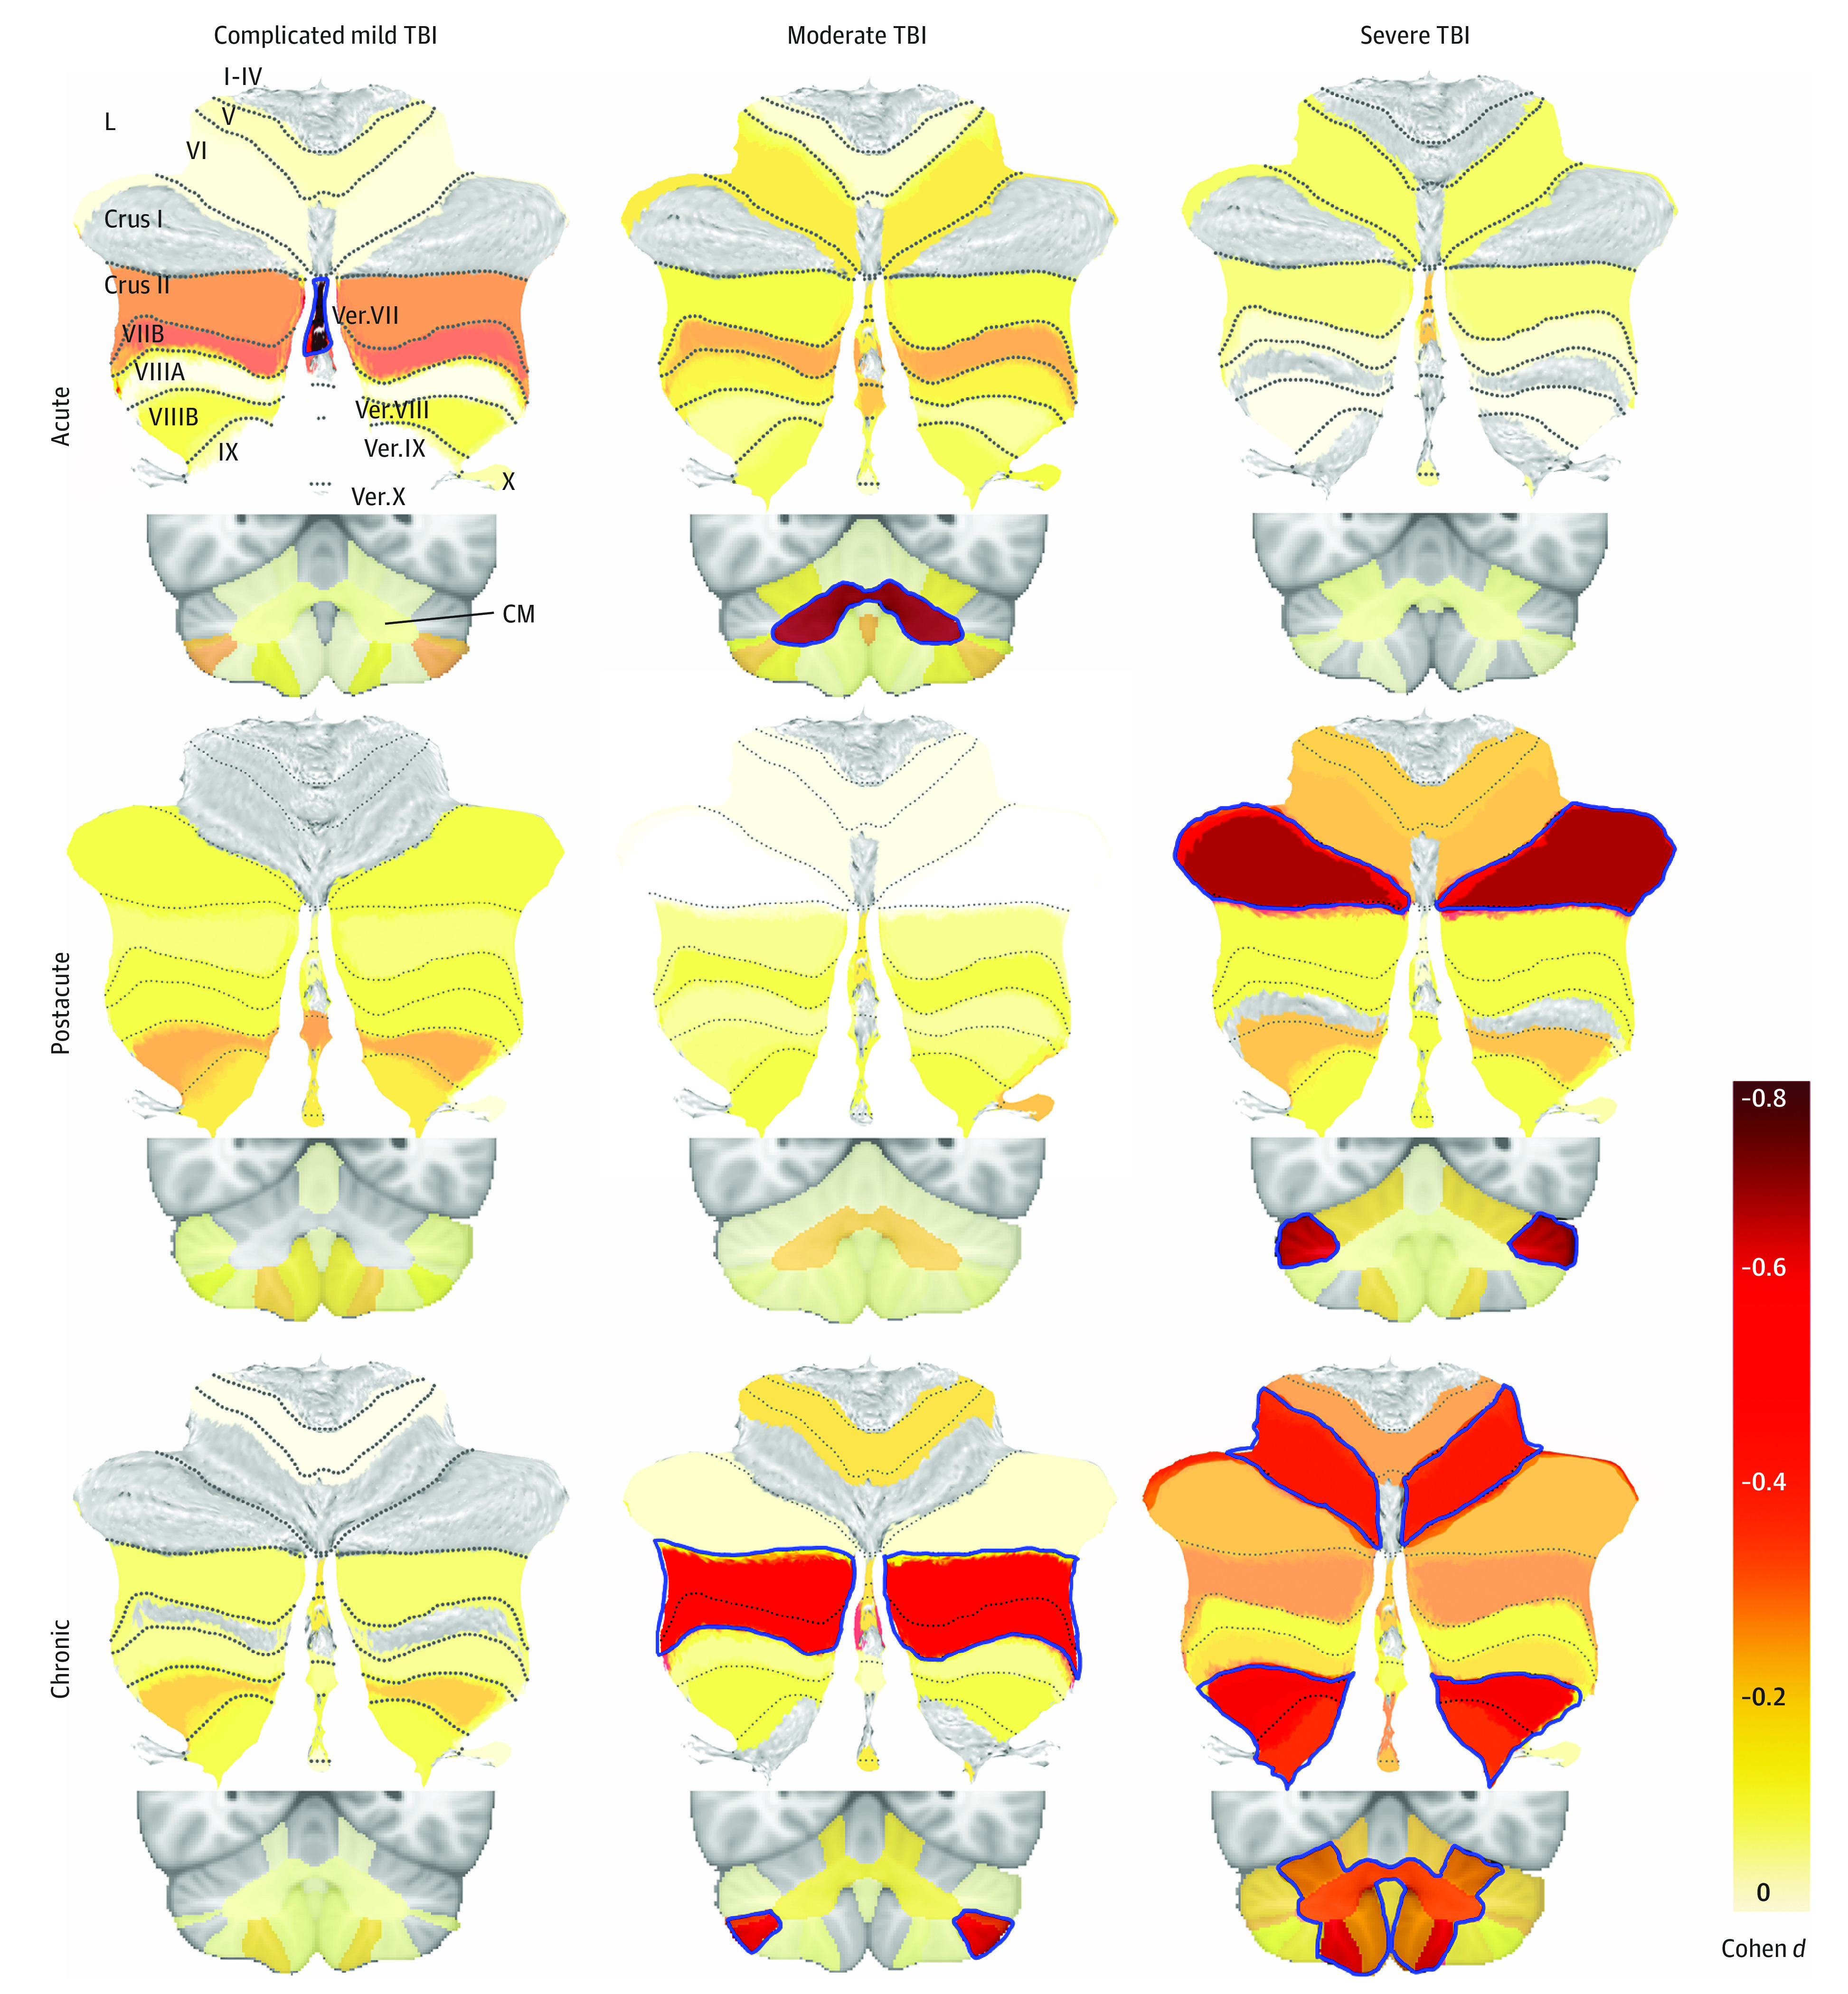
Figure 2. Severity and Chronicity Analyses.

Atlas-based effect size (Cohen d) maps and Montreal Neurological Institute–based coronal slices are shown for group comparisons separated by severity (columns) and chronicity (rows). Lobules and vermal regions (Vermis [Ver.] VII-X) are labeled in the top left on the spatially unbiased infratentorial template flatmap. The corpus medullare (CM) is shown in the coronal slices. The color corresponds to the effect size, according to the color bar, with dark red for the largest effect sizes. Nonsignificant effect sizes are shown at 50% opacity, whereas significant ones are not opaque and outlined in blue. The number of traumatic brain injury (TBI) and non-TBI participants for each comparison are as follows: 12 participants with acute complicated mild TBI, 7 participants with acute moderate TBI, and 25 patients with acute severe TBI, who were each compared with 82 non-TBI participants; 26 patients with postacute complicated mild TBI, 12 patients with postacute moderate TBI, and 43 patients with postacute severe TBI, who each compared with 143 non-TBI participants; and 32 patients with chronic complicated mild TBI, 18 patients with chronic moderate TBI, and 71 patients with chronic severe, who were each compared with 209 non-TBI participants. No TBI participant was included twice in any of the 9 subanalyses, but non-TBI participants were included across multiple comparisons. Only negative effect sizes are shown; positive effect sizes were not significant and are not included.
