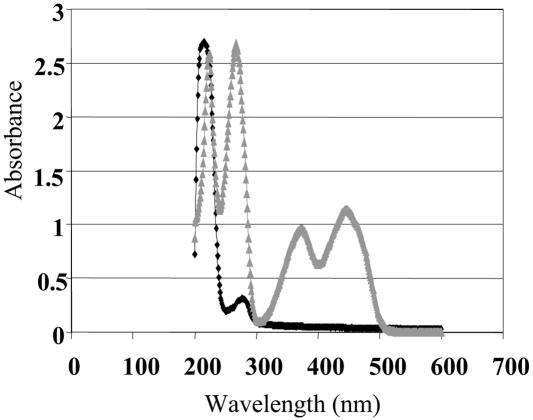
FIG. 7.
Absorption spectra of the purified NfrA protein and free FMN. The black symbols show the spectrum of NfrA at a concentration of 0.3 mg/ml (9.4 μM), and the grey symbols show the spectrum at 10 μM FMN in 0.1 M NaPO4 buffer (pH 6.8) containing 50 mM NaCl. The NfrA spectrum has peaks at 214 and 280 nm, whereas the peaks for free FMN are at 224, 268, 375, and 448 nm.

