
FIGURE 2.
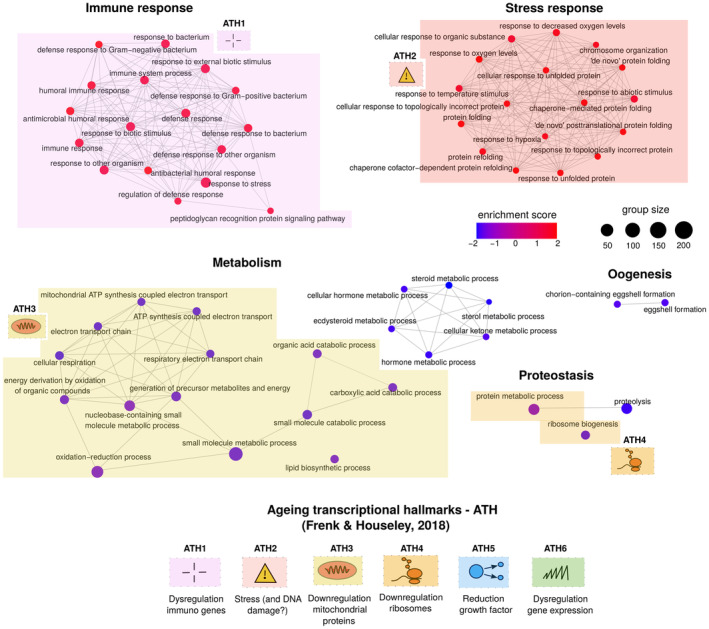
Gene Set Enrichment Analysis (GSEA) analysis (Gene ontology biological process categories) of Smurf‐specific genes. GSEA results are represented as a network, where nodes are significantly enriched categories (deregulation colour code as in legend) and edges are connected categories with overlapping genes. From the 59 significant categories, we identified and manually annotated five hubs: immune response, stress response, metabolism, proteostasis and oogenesis. Hallmarks of transcriptional ageing, as enunciated in (Frenk & Houseley, 2018) (bottom of figure). The hallmarks present in the Smurf‐specific signature (ATH1‐4) are mapped close to the related categories. Overall, in the Smurfs specific genes we detect four hallmarks of transcriptional ageing. Note that the DNA damage response (ATH4) is indicated with a question mark in the figure following the conflicting data presented by Frenk & Houseley. No category maps to ATH5 (reduction in growth factor, downregulation of cell cycle genes) and ATH6 (increased transcriptional hetereogeneity, DNA and RNA dysregulation).