FIGURE 2.

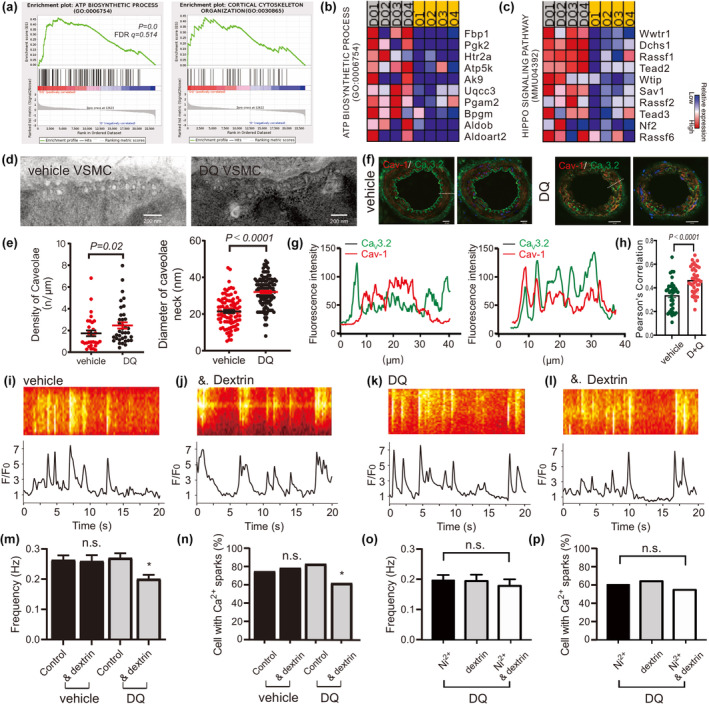
D + Q promote caveolae remodeling and CaV3.2‐Cav‐1 co‐localization to rescue caveolar CaV3.2‐RyR axis in aged VSMC. (a–c), shown are gene set enrichment analyses (a) and heat maps for the top 10 up‐regulated genes (b, c) for ATP BIOSYNTHETIC PROCESS and MICROTUBULE CYTOSKELETON ORGANIZATION in D + Q compared with vehicle group. (d, e), electron microscopy image of a vehicle and a D + Q treated VSMC, and summary of the results. Caveolae density, diameter of caveolae neck in VSMCs from vehicle‐ versus D + Q‐treated mice (four mice in each group). (f‐g), confocal immunofluorescence images and the line course of fluorescence changes. Immunofluorescently labeled with CaV3.2 (green) and Cav‐1 (red) in mesenteric arteries from vehicle‐ and D + Q‐treated mice. Bar, 20 μm. (h), Pearson's correlation coefficients for colocalization assays. The plot shows Pearson's correlation coefficients for the colocalization analysis (n = 30–40 arteries). The Kruskal–Wallis H test was used for calculating statistical differences. Arteries were isolated from four mice in each group. (i), Ca2+ fluorescence line scan images of a Fluo‐4‐AM–loaded VSMC from a middle aged mouse and the time course of Ca2+ fluorescence changes. (j), same as (h) but in the presence of Ni2+ (50 μM). (k), same as (h) but in the cell from a D + Q treated aged mouse. (l), same as (j) but in the presence of Ni2+. (m–p), summary of the results. Ca2+ spark frequency (m) and fraction of cells producing Ca2+ sparks (n) in VSMCs from aged mice (n = 124), in VSMCs from aged mice incubated with Ni2+ (n = 109), in VSMCs from D + Q‐treated aged mice (n = 176), and in VSMCs from D + Q‐treated aged mice incubated with Ni2+ (n = 115). Ca2+ spark frequency (o) and fraction of cells producing Ca2+ sparks (p) in VSMCs from D + Q treated aged mice incubated with Ni2+ (n = 112), with methyl‐β‐cyclodextrin (n = 108), as well as Ni2++methyl‐β‐cyclodextrin (n = 96). Cells were isolated from four mice in each group. VSMC, vascular smooth muscle cell. *p < 0.05; n.s., not significant.
