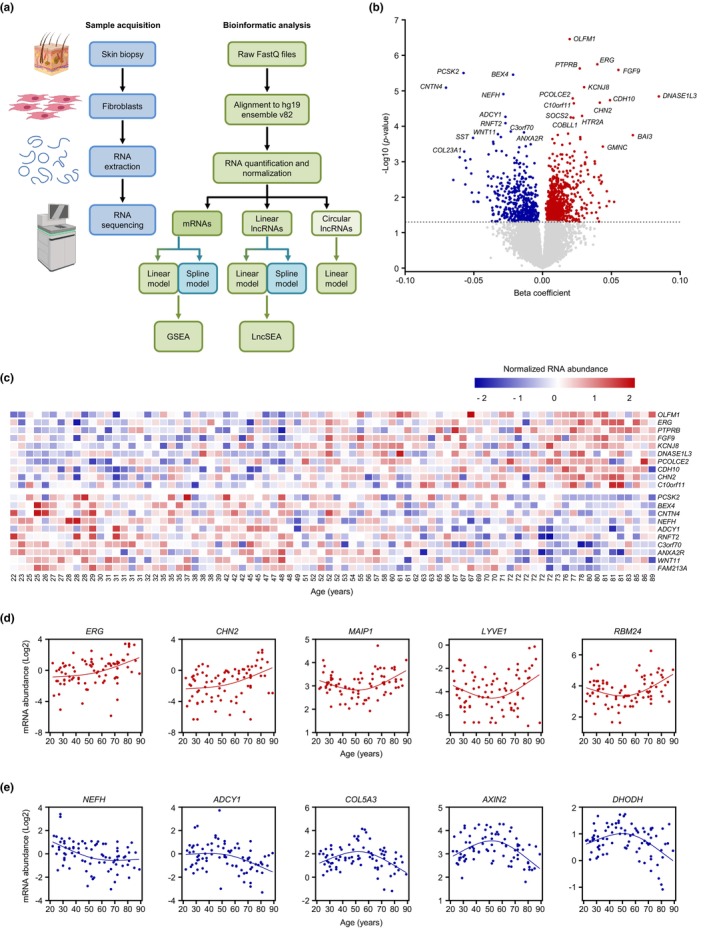
FIGURE 1.

Differentially expressed coding transcripts (mRNAs) with advanced aging. (a) Workflow of sample acquisition and preparation (blue) and bioinformatic analysis (green) followed in this study. (b) Volcano plot showing beta coefficients of mRNAs expressed with age (per year). Transcripts showing significantly increased (red dots) or decreased (blue dots) levels with age (p < 0.05, adjusted for covariates) are indicated. Gray dots show transcripts that did not change significantly with age (p > 0.05). (c) Heatmap of the top 10 significantly elevated mRNAs (top) and top 10 significantly reduced mRNAs (bottom) with age based on a linear regression model (unadjusted p‐values). (d,e) Graphs of mRNAs showing differentially increased (d) or decreased (e) slopes after 50 years of age based on a spline regression model (unadjusted p‐values). In (b), the R 2 values for the reported transcripts increasing with advancing age are as follows: R 2 = 0.25 for OLFM1 mRNA; R 2 = 0.14 for ERG mRNA; R 2 = 0.21 for PTPRB mRNA; R 2 = 0.14 for FGF9 mRNA; R 2 = 0.16 for KCNJ8 mRNA; R 2 = 0.081 for DNASE1L3 mRNA; R 2 = 0.16 for PCOLE2 mRNA; R 2 = 0.16 for CDH10 mRNA; R 2 = 0.13 for CHN2 mRNA; and R 2 = 0.14 for C10orf11 mRNA. Similarly, for the reported transcripts decreasing with advancing age, the R 2 values are as follows: R 2 = 0.13 for PCSK2 mRNA; R 2 = 0.18 for BEX4 mRNA; R 2 = 0.11 for CNTN4 mRNA; R 2 = 0.15 for NEFH mRNA; R 2 = 0.11 for ADCY1 mRNA; R 2 = 0.15 for RNFT2 mRNA; R 2 = 0.18 for C3orf70 mRNA; R 2 = 0.18 for ANAX2R mRNA; R 2 = 0.081 for WNT11 mRNA; and R 2 = 0.13 for FAM213A mRNA.
