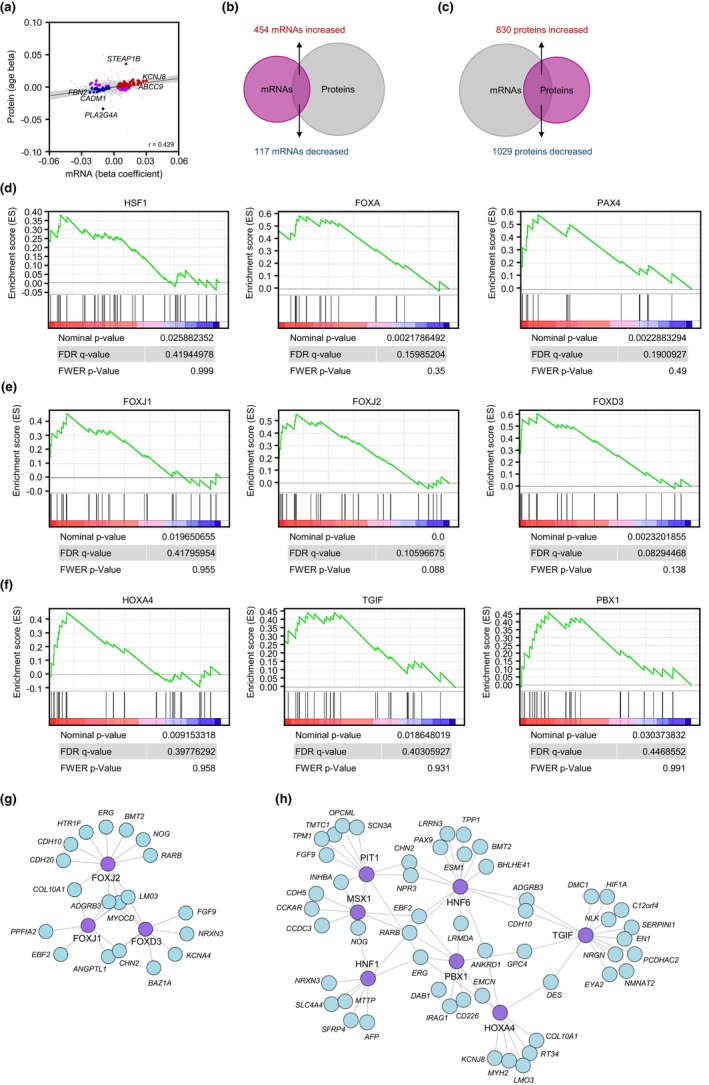
FIGURE 2.

Transcription factors (TFs) putatively driving the expression of differentially abundant mRNAs with age based on a linear regression model. (a) Correlations between differentially abundant mRNAs (unadjusted p‐value <0.05) and differentially abundant proteins (unadjusted p‐value <0.05; Tsitsipatis et al., 2022) from the same cohort as a function of age. Proteins and mRNAs changing in the same direction are indicated with red dots (both increased) or blue dots (both decreased), while proteins and mRNAs changing in opposite directions are indicated in purple dots (Pearson correlation coefficient, r = 0.429). Gray dots represent instances in which either the mRNA levels or the protein levels did not change significantly (unadjusted p‐value >0.05). (b) Overlap of differentially abundant mRNAs (unadjusted p‐value <0.05) for which the levels of encoded proteins were not significantly changed (unadjusted p‐value >0.05). (c) Overlap of differentially abundant proteins (unadjusted p‐value <0.05) encoded by mRNAs that did not show significant changes in abundance (unadjusted p‐value >0.05). (d) TFs HSF1, FOXA, and PAX4 (above the graphs), previously associated with longevity, capable of transcribing mRNAs that were enriched with age by the GSEA method. (e,f) TFs in the FOX (e) or HOX (f) families whose transcribed mRNAs were preferentially elevated in older individuals by the GSEA method. (g,h) Network of differentially expressed mRNAs, predicted to be transcriptionally induced by the FOX (e) or HOX (f) transcription factors.
