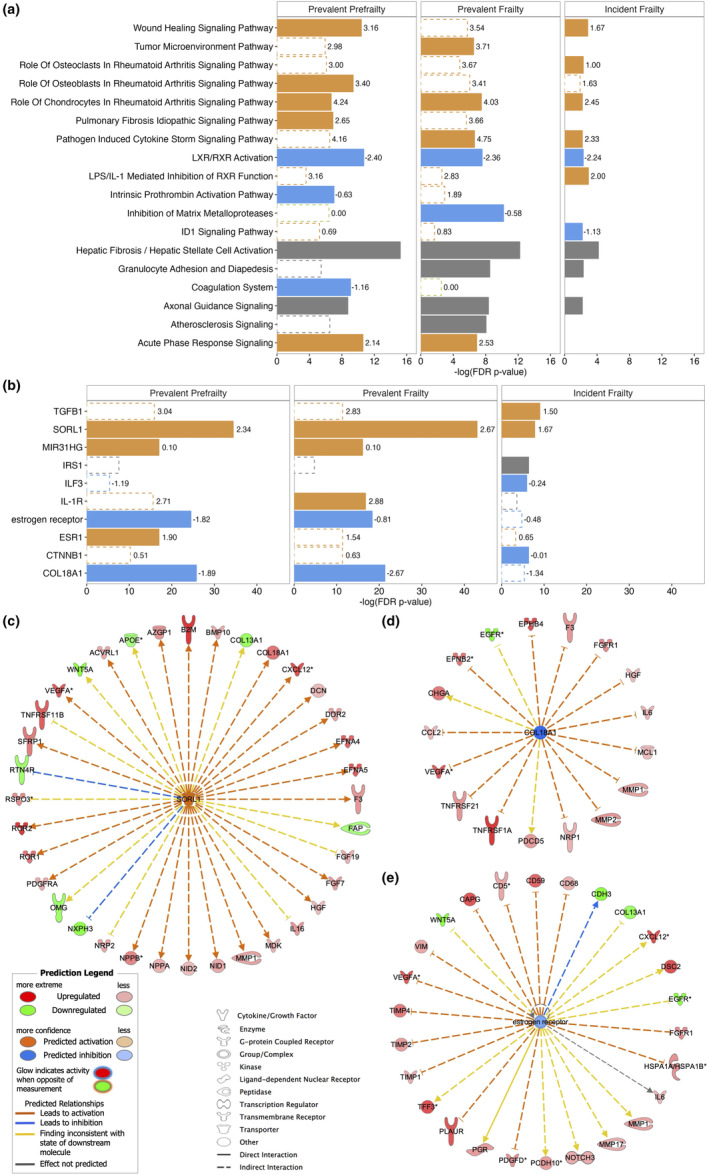
FIGURE 5.

The top 10 enriched pathway (a) and top 5 upstream regulators (b) among proteins associated with prevalent prefrailty, prevalent frailty, and incident frailty, and the target proteins of SORL1 (c), COL18A1 (d), and estrogen receptor (e) in ARIC. Solid bars denote the top 10 pathways or top 5 regulators for each analysis. Open bars with a dashed outline denote pathways or regulators that are significantly enriched after FDR correction but are not among the top 10 pathways or top 5 regulators for the specific analysis. The length of the bar denotes the ‐log(p‐values after FDR correction). Orange color denotes pathways or regulators that are predicted to be activated (z‐score labeled at the end of the bar > 0). Blue color denotes pathways or regulators that are predicted to be inhibited (z‐score < 0). Green color denotes pathways or regulators that are predicted to be neither activated nor inhibited (z‐score = 0). Gray color denotes pathways or regulators whose activation/inhibition states are not predicted. TGB1, transforming growth factor beta‐1; SORL1, sortilin‐related receptor 1; MIR31HG, MIR31 host gene; IRS1, insulin receptor substrate 1; ILF3, interleukin enhancer binding factor 3; IL‐1R, interleukin‐1 receptor; ESR1, estrogen receptor 1; CTNNB1, Catenin Beta 1; COL18A1, collagen type XVIII alpha 1 chain.
