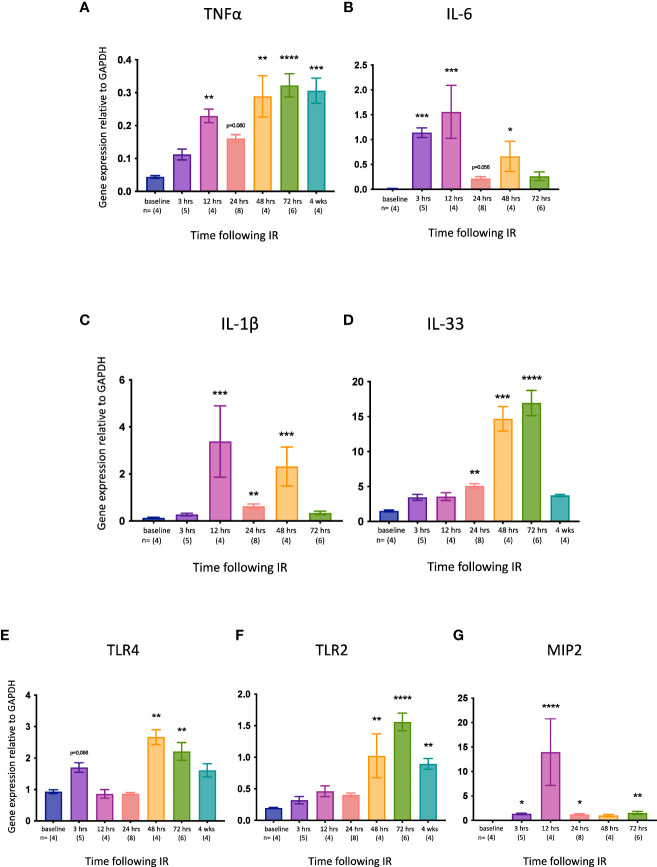
Figure 2.
Time course of pro-inflammatory gene expression in the left kidney after IR in WT mice. (A): Tnfa; (B): Il6; (C): Il1b; (D): Il33; (E): Tlr4; (F): Tlr2. (G): Mip2. Kruskal-Wallis test with Dunn multiple comparisons test with * p<0.05, ** p<0.01, *** p<0.001, **** p<0.0001 compared to baseline control. Data presented as mean ± SEM.

