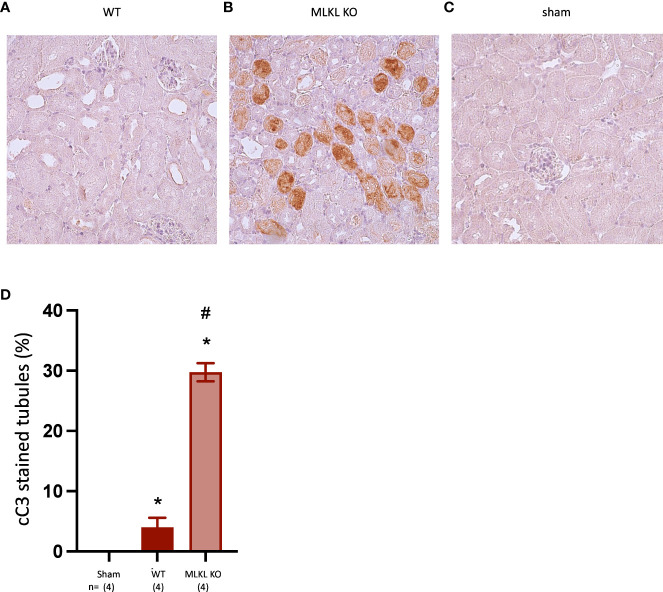
Figure 6.
Comparison of cleaved Caspase-3 staining in WT and Mlkl-ko mice at 24 hrs post-reperfusion. (A): WT; (B): Mlkl-ko; (C): sham; (D): semi-quantitative analysis. Mann Whitney U test with * p<0.05 compared to sham procedure and # p<0.05 compared to WT mice. Data presented as mean ± SEM. Image magnification x 200.

