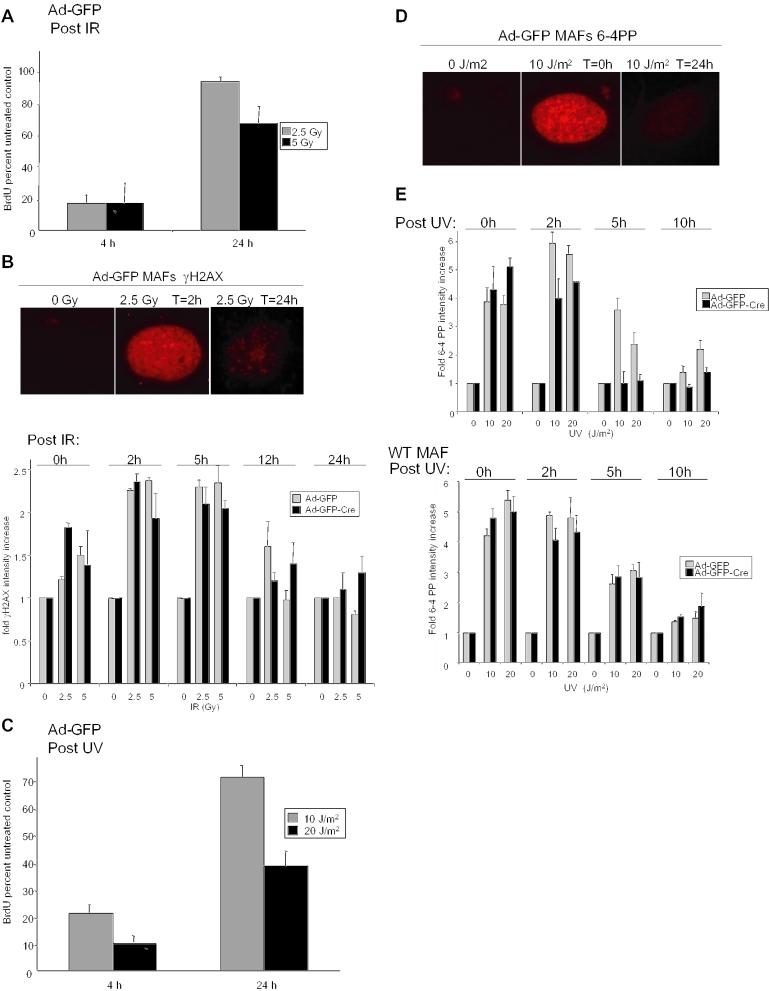
Figure 4.
Differential effects of acute RB loss on UV- and IR-induced DNA lesion removal. (A) Ad-GFP or Ad-GFP-Cre infected MAFs were exposed to 0, 2.5 or 5 Gy IR and cultured for 4 or 24 h in the presence of BrdU for the final 4 h prior to harvest. Immunofluorescent detection was employed and BrdU positive cells were scored and represented as percent untreated control. (B) Asynchronously growing MAFs infected with either Ad-GFP or Ad-GFP-Cre were exposed to 0 or 2.5 Gy IR. At 0, 2, 5, 12 and 24 h after cell irradiation, samples were fixed and analyzed for γH2AX foci formation by immunofluorescence using an anti-γH2AX monoclonal antibody (top panel). The relative abundance of γH2AX foci was determined through quantification of staining intensity in images taken at equal exposures using Metamorph software (bottom panel). These data are represented graphically as the relative increase in γH2AX intensity. (C) Adenovirally infected MAFs were treated with 0, 10, 20 J/m2 UV and cultured for 4 or 24 h in the presence of BrdU for the final 4 h. Scoring of BrdU immunofluorescence revealed the percent of treated cells that were BrdU positive with respect to untreated controls. (D) Ad-GFP and Ad-GFP-Cre infected MAFs were treated with 0 or 10 J/m2 UV and harvested at 0 and 24 h post-treatment for 6-4 PP immunofluorescence. Images of equal exposure were taken. (E) MAFs from (D) were treated with 0, 10 or 20 J/m2 UV and cultured for 0, 2, 5 or 10 h post-UV. Cells were then harvested and immunofluorescence for 6-4 PP was performed. Microscopic images of equal exposures were obtained and the relative abundance of 6-4 PPs were quantified using Metamorph software. The data are represented graphically as fold 6-4 PP intensity increase (top panel). Wild-type MAF control cells lacking loxP sites were cultured and infected with Ad-GFP or Ad-GFP-Cre. Five days post-infection, wild-type cells were treated with UV and analyzed for 6-4 PP repair as in top panel (bottom panel).

