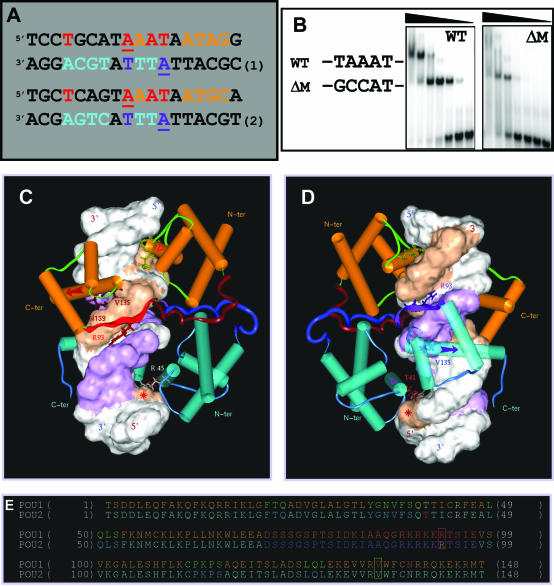
Figure 4.
Structural determinants of the N-Oct-3 POU homodimerization on the CRH gene promoter. (A) Alignment of the 18 bp core regions of the CRH (sequence 1) and AADC (sequence 2) promoter fragments based on the homology between the respective high-affinity binding sites for N-Oct-3 DBD. Same color coding as in Figure 1A. (B) Conversion of the TAA triplet (in boldface) of the 24 bp CRH promoter fragment (‘WT’) GCTCCTGCATAAATAATAGGGCCC to GCC (mutant ‘ΔM’) and EMSA analysis of the differential binding pattern of the N-Oct-3 DBD to the two oligonucleotides. (C and D) Modeled structure of the homodimeric complex between the N-Oct-3 DBD and the 18 bp CRH promoter fragment (sequence 1). Front views focusing on the first (C) and second (D) POU domain interactions with DNA. See the text for a detailed description. Same color coding as in Figure 1B–D. The ‘footprints’ on both strands of the first and second DBDs are shown as brown and purple-colored Connolly surfaces, respectively. (E) Same comment and color coding as in Figure 2D, except for POUs1 Gln 40, Thr41 and Arg 45 colored in yellow, and POUs2 Thr 41 and Arg 45 in red and white, respectively.

