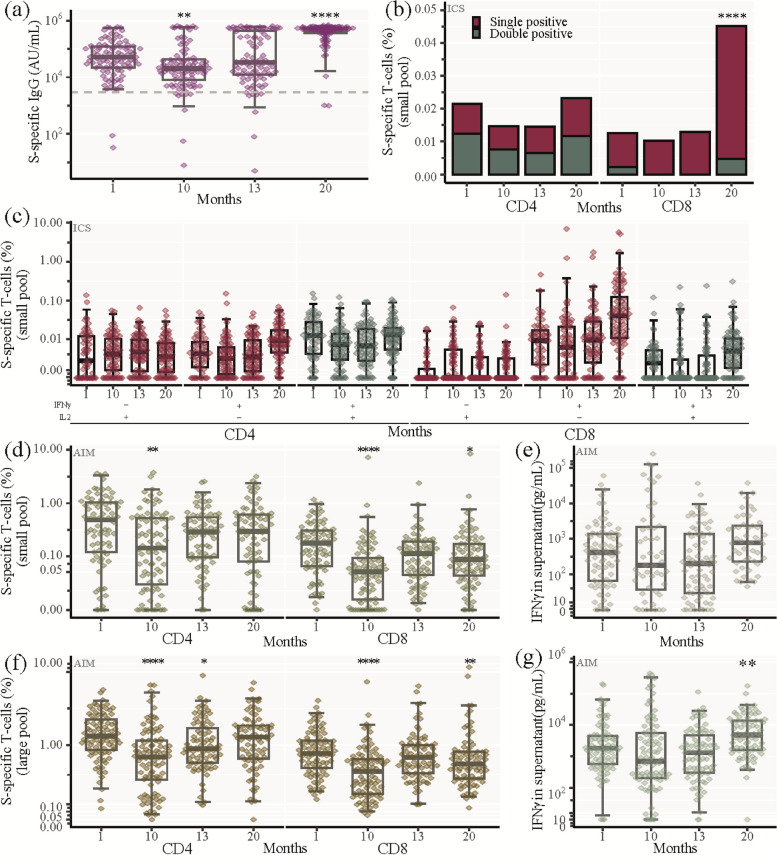
Fig. 3.
SARS-CoV-2 Spike-specific longitudinal immune response. a SARS-CoV-2 spike (S)-specific IgG analysed by Mesoscale. Being seropositive was defined as IgG above 3000 AU/mL (dashed line). b, c Percentage of SARS-CoV-2 S-specific CD4 + and CD8 + memory T cells analysed by ICS after stimulation with the S-small peptide pool. b Total SARS-CoV-2 S-specific CD4 + and CD8 + T memory cells at indicated time points. IFNγ only and IL2 only producing cells: red bar, IFNγ and IL2 double producing cells: green bar. Stacked bars represent median values. c Percentage of SARS-CoV-2 S-specific CD4 + and CD8 + memory T cells producing either IL2 only (red, left panel), IFNγ only (red, middle panel), or co-producing IFNγ and IL2 (green, right panel) at each visit. d-g Percentage of SARS-CoV-2 S-specific CD4 + and CD8 + T cells analysed by AIM after stimulation with the S-small (d, e) or the large (f, g) peptide pool, i.e., cells expressing 2 or 3 activation induced markers (CD69, OX40 or 41BB). d SARS-CoV-2 S-specific CD4 + and CD8 + T cells at indicated time points (S-small pool). e IFNγ production by SARS-CoV-2 S-specific cells (S-small pool) (Analysed by mesoscale). f SARS-CoV-2 S-specific CD4 + and CD8 + T cells at indicated time points (S-large pool). g IFNγ production by SARS-CoV-2 S-specific cells (S-large pool) (Analysed by mesoscale). a, c, d-g Box and whisker plots show median values ± IQR and error bars indicate 95% CI. Statistical comparisons were performed using Friedman test and Wilcoxon unpaired signed-ranks test adjusted using Bonferroni with visit 1 as a reference. *P ≤ 0.05, **P < 0.01, ***P < 0.001, ****P < 0.0001, no asterisk indicates non-significance

