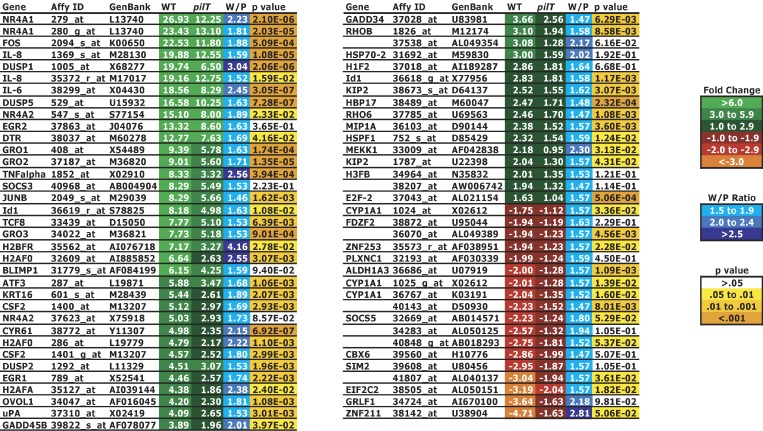
Figure 1. Infection-Regulated, Retraction-Enhanced Epithelial Cell Genes.
Wt and pilT values represent the mean fold-change in the transcript level of each gene in infected cells compared to uninfected cells (n = 2). W/P values represent the degree of enhancement of gene expression resulting from pilus retraction and are the result of dividing the wt fold-change value by the pilT fold-change value from two independent experiments. The p-value for each gene represents the statistical significance of the difference in its expression level (as determined by Cyber-T analysis) between wt and pilT. The color code assigned to each gene represents its degree of response to infection as expressed by its fold-change value, W/P, and p-value.

