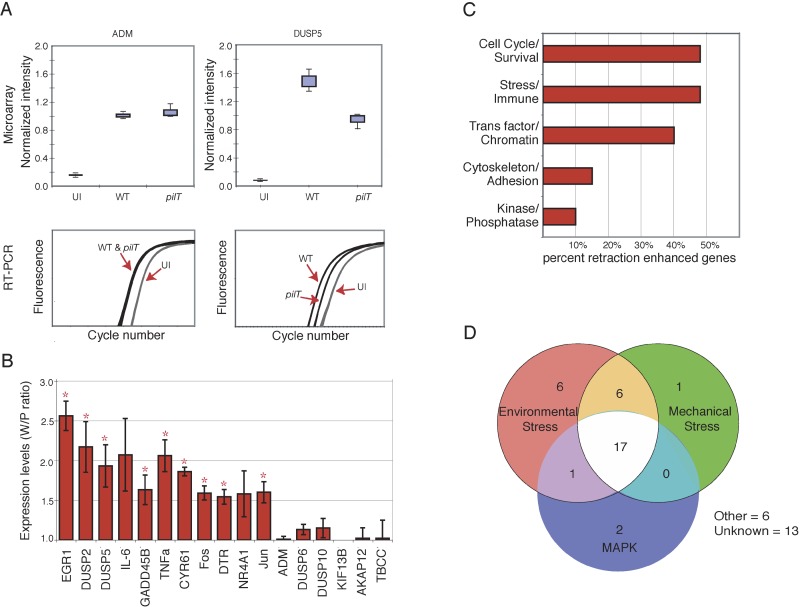
Figure 2. Real-Time Quantitative RT-PCR Verification of Microarray Results and Initial Characterization of Retraction-Enhanced Genes.
(A) Microarray (top panels) and real-time quantitative RT-PCR (bottom panels) expression profiles of ADM and DUSP5 in uninfected cells (UI), N400-infected cells (WT), and N400pilT-infected cells(pilT). Microarray data are shown as box-plots (n = 3). RT-PCR data are plotted as triplicate samples from one representative experiment.
(B) Real-time quantitative RT-PCR verification of retraction-enhanced expression of selected genes. Data are expressed as average W/P (±SEM, n = 3). Genes with a W/P statistically greater than 1.0 (p < 0.05) are denoted with an asterisk.
(C) Grouping of retraction-enhanced genes according to function, based on published reports (see Table S1). Some genes have multiple functions and thus appear in more than one group.
(D) Genes in this study that are known to be induced by environmental stress, mechanical stress, or MAPK signaling (see Table S1).

