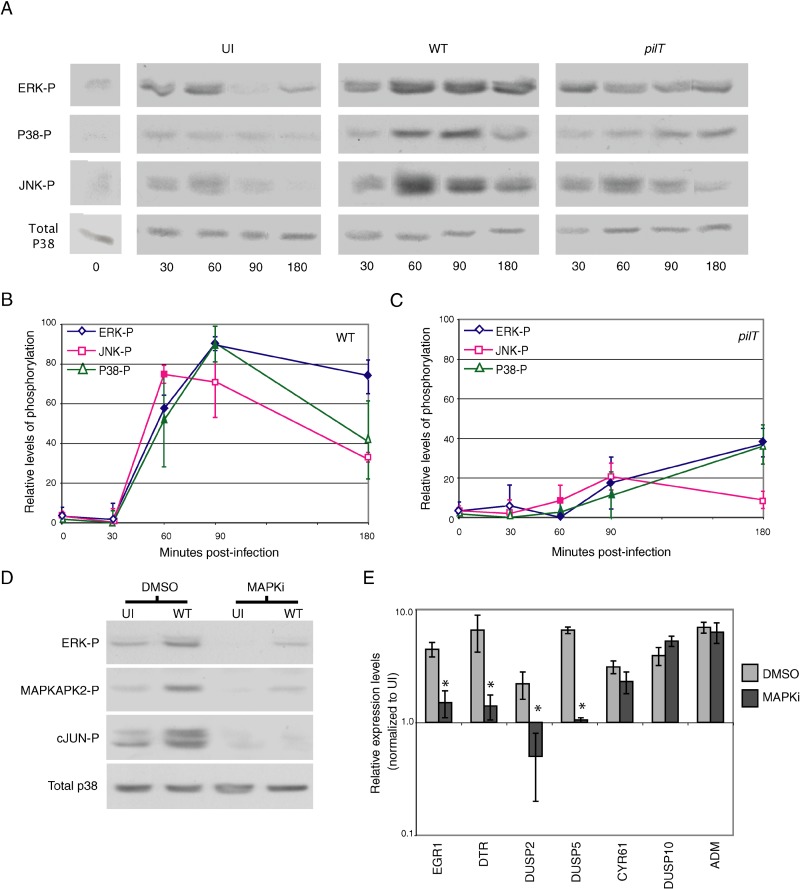
Figure 3. Levels of Activated MAPK in Infected Cells and Their Involvement in Retraction-Enhanced Gene Expression.
(A) Representative immunoblot showing ERK-p, P38-p, and JNK-p, in uninfected cells before (0 h) and after medium change (UI), or in cells infected with N400 (WT) or N400pilT (pilT). Total P38 protein levels in each sample served as the internal control (bottom lanes).
(B and C) ERK-p JNK-p, and P38-p levels over time in cells infected with N400 and N400pilT, respectively. Immunoblots from (A) were analyzed by densitometry, and levels of activated kinase from infected cells were normalized to that from uninfected cells (UI). Values represent mean normalized protein levels (±SEM, n = 2). Solid markers indicate a significant difference between wt and pilT-induced MAPK phosphorylation at that time point (p < 0.05); thus, ERK-p is significant at 60, 90, and 180 min; JNK-p is significant at 60 min; and P38-p is significant at 60 and 90 min.
(D) Representative immunoblot showing ERK-p, MAPKAPK2-p, and c-Jun-p in cells preincubated with vehicle (DMSO) or MAPK inhibitors and infected for 90 min with N400 (WT) or left untreated (UI). Total P38 protein levels in each sample served as the internal control (bottom lanes).
(E) Real-time quantitative RT-PCR analysis of the effect of MAPK inhibitors on the expression of retraction-responsive genes. Light bars indicate cells infected with N400 in the presence of vehicle (DMSO); dark bars indicate cells infected with N400 in the presence of MAPK inhibitors. Values represent the fold-change (±SEM, n = 2) in transcript levels compared to uninfected, DMSO treated control. A significant difference in expression between the two conditions is denoted by an asterisk (p < 0.1).

