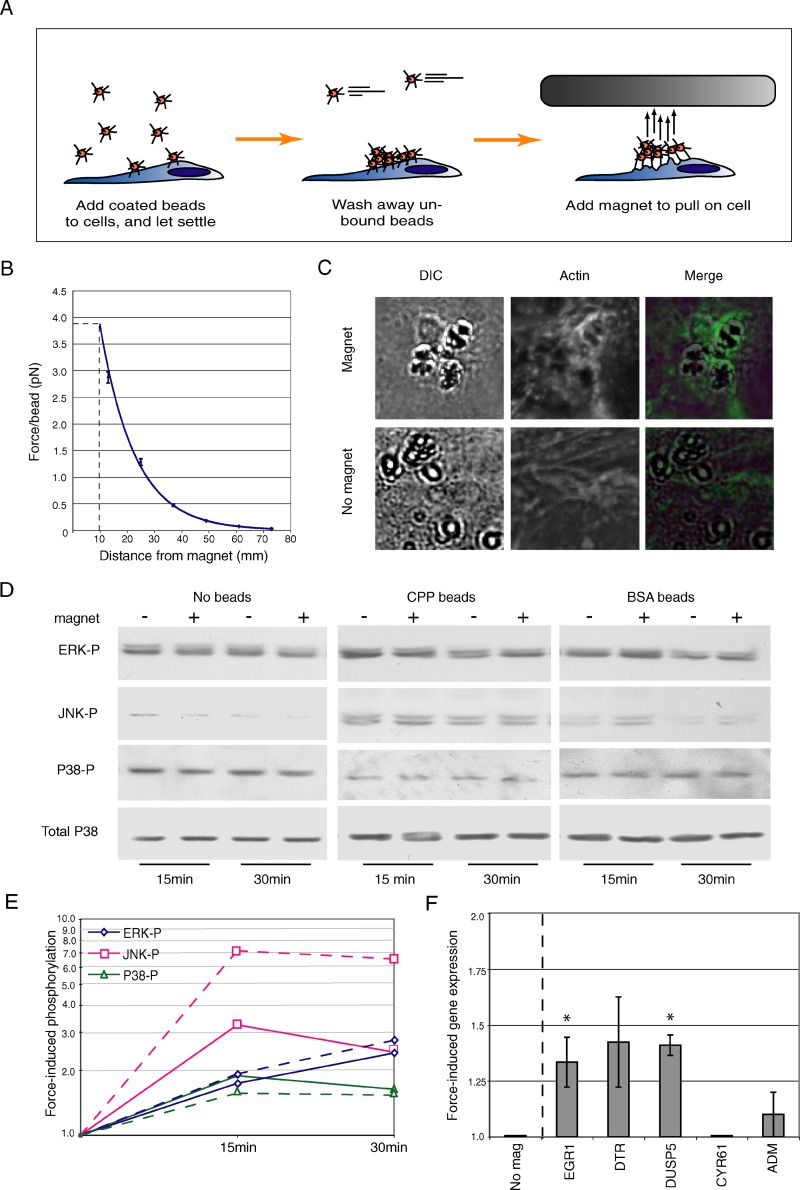
Figure 4. Artificial Force Triggers MAPK Phosphorylation and Induces the Expression of Retraction-Enhanced Genes.
(A) Representation of the magnet/magnetic bead assay.
(B) Average force generated on one bead as a function of magnet distance from the culture dish. Data represent the forces calculated from four identical magnets (±SEM). All subsequent assays were performed using a magnet distance of 10 mm, which corresponds to a force of 4 pN per bead (dotted line).
(C) Magnet-induced clustering of actin beneath magnetic beads. CPP-coated beads were seeded onto T84 cells and exposed to the magnet for 1 h (top panels) or left untreated (no magnet, bottom panels). Differential interference contrast images (left panels) reveal the location of the beads; phalloidin staining (middle panels) shows the presence of actin at the same site. Right panels show the two previous images merged.
(D) Representative immunoblot of ERK-p, JNK-p, and P38-p in cells seeded with CPP-coated beads, BSA-coated beads, or no beads, and exposed to the magnet for 15 or 30 min. Total P38 protein levels in each sample served as the internal control (bottom panels).
(E) Quantitation of ERK-p, JNK-p, and P38-p signals by densitometry from the representative immunoblot shown in (D), normalized to the no-bead control. Solid lines indicate signals from cells exposed to membrane-coated beads; dotted lines indicate signals from cells exposed to BSA-coated beads.
(F) Real-time quantitative RT-PCR analysis of the transcript levels of selected genes in cells seeded with CPP beads and exposed to the magnet for 3 h. Data represent the average fold-change (±SEM, n = 2) compared to a no-magnet control. A significant difference in expression on force induction is denoted by an asterisk (p < 0.1).

