FIGURE 5.

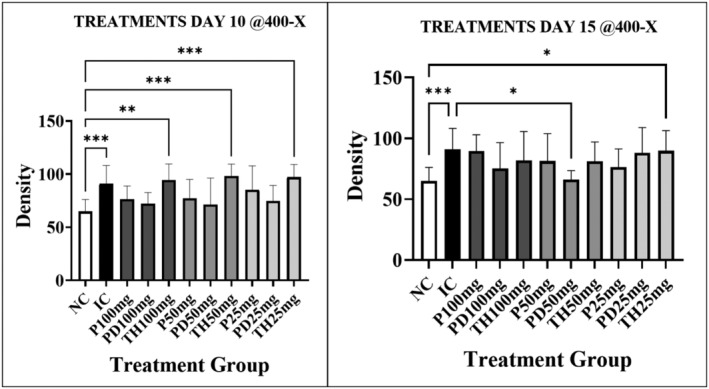
Effects of Immulina therapy and delivery protocol on lung density on days 10 and 15. The data presented in the graphs depict the mean ± one standard deviation. Asterisk indicates strength of significance.

Effects of Immulina therapy and delivery protocol on lung density on days 10 and 15. The data presented in the graphs depict the mean ± one standard deviation. Asterisk indicates strength of significance.