
Figure 3.
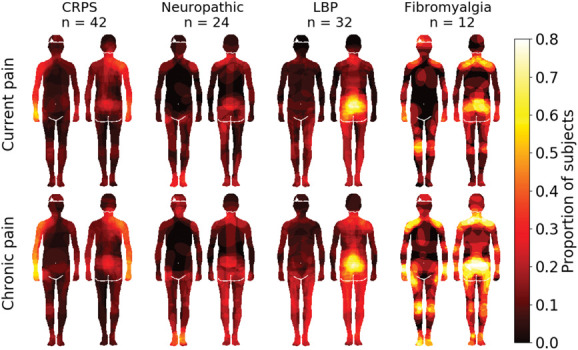
Pain maps across the different patient groups. Pixel intensities show the proportion of individuals, in each group, who had coloured each pixel. N.B.: The maps acquired from patients with CRPS were rotated such that the affected side is always depicted on the right hand side of the drawing. The data are thresholded at P < 0.05, FDR corrected.