
Fig. 5.
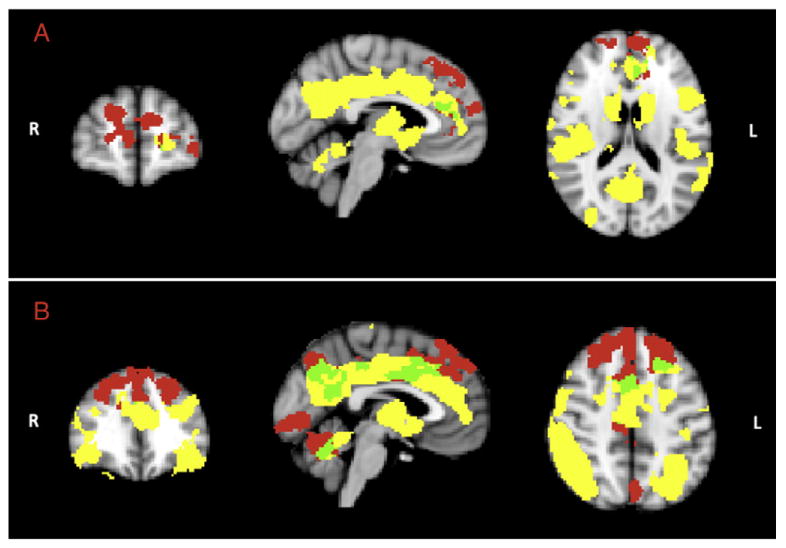
Areas of overlap between task-based difference and GM volume reduction (A) and frontal RSN difference and brain morphology reduction (B). Yellow denotes GM volume difference between the two study groups. Red denotes, task-based or RSN difference between younger and older group not overlapping with GM volume reduction. Green denotes areas of overlap between group-related task or RSN differences and GM volume changes.