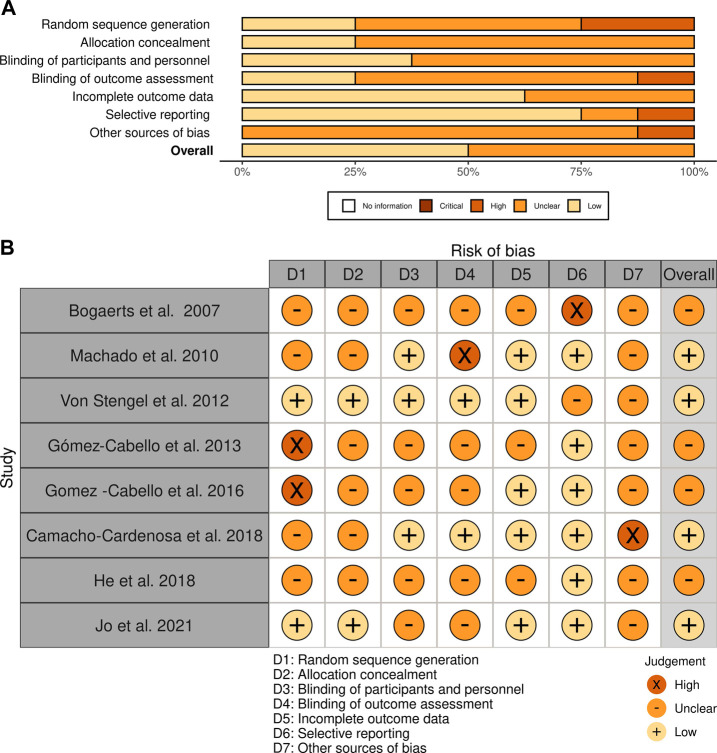
FIGURE 3.
Risk of bias assessment of the studies included in this review using Cochrane. (A) The figure shows the evaluation of the quality of the included studies. White = no information; dark brown = critical; light brown = high; orange = unclear; pinkish = low risk of bias. (B) The figure presents an assessment of the quality of the included studies and the risk of bias: “+” means low risk of bias; “x” means high risk of bias; “–” means unclear risk of bias.

