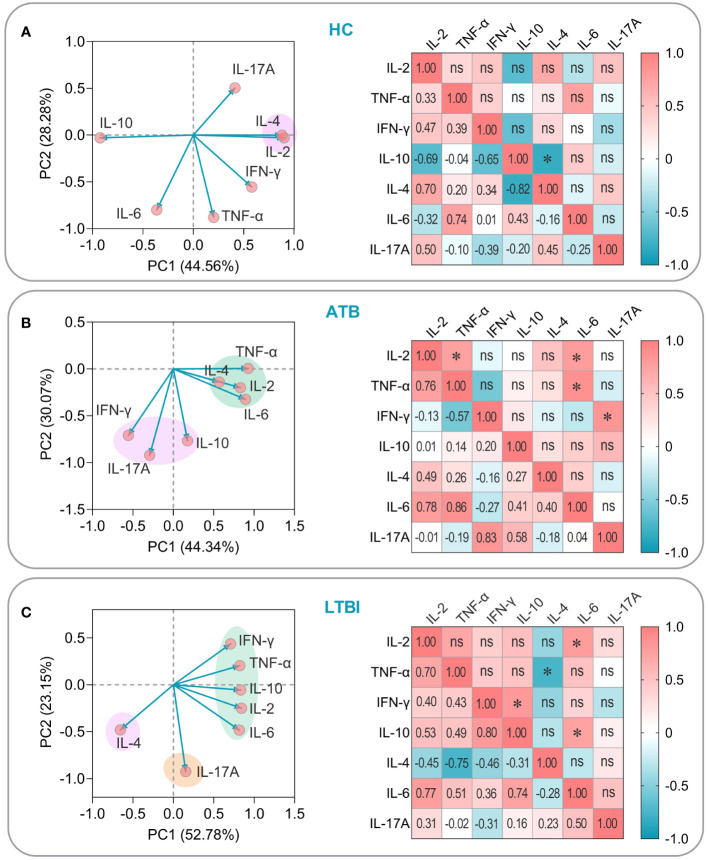
Figure 11.
PCA and correlation analysis of cytokines induced by the PP13138R vaccine in HCs, ATB patients, and LTBI populations. The potential relationships among IL-2, TNF-α, IFN-γ, IL-4, IL-6, IL-10, and IL-17A cytokines induced by the PP13138R vaccine in HCs (A), ATB patients (B), and LTBI populations (C) were analyzed by using PCA and Pearson’s R analysis using GraphPad Prism 9.5.1 software, respectively. In the PCA analysis, we selected PCs with eigenvalues greater than 1 for further analysis. The two principal components with the largest variance values are shown in the PCA loading plot, and their percentages are shown on the x-and y-axes, respectively. Furthermore, the correlation coefficients R and P values of the cytokines with each other were shown in the lower left and upper right halves of the correlation matrix plot, respectively. P < 0.05 was considered to be a significant difference. *, P < 0.05; ns, no significance.

