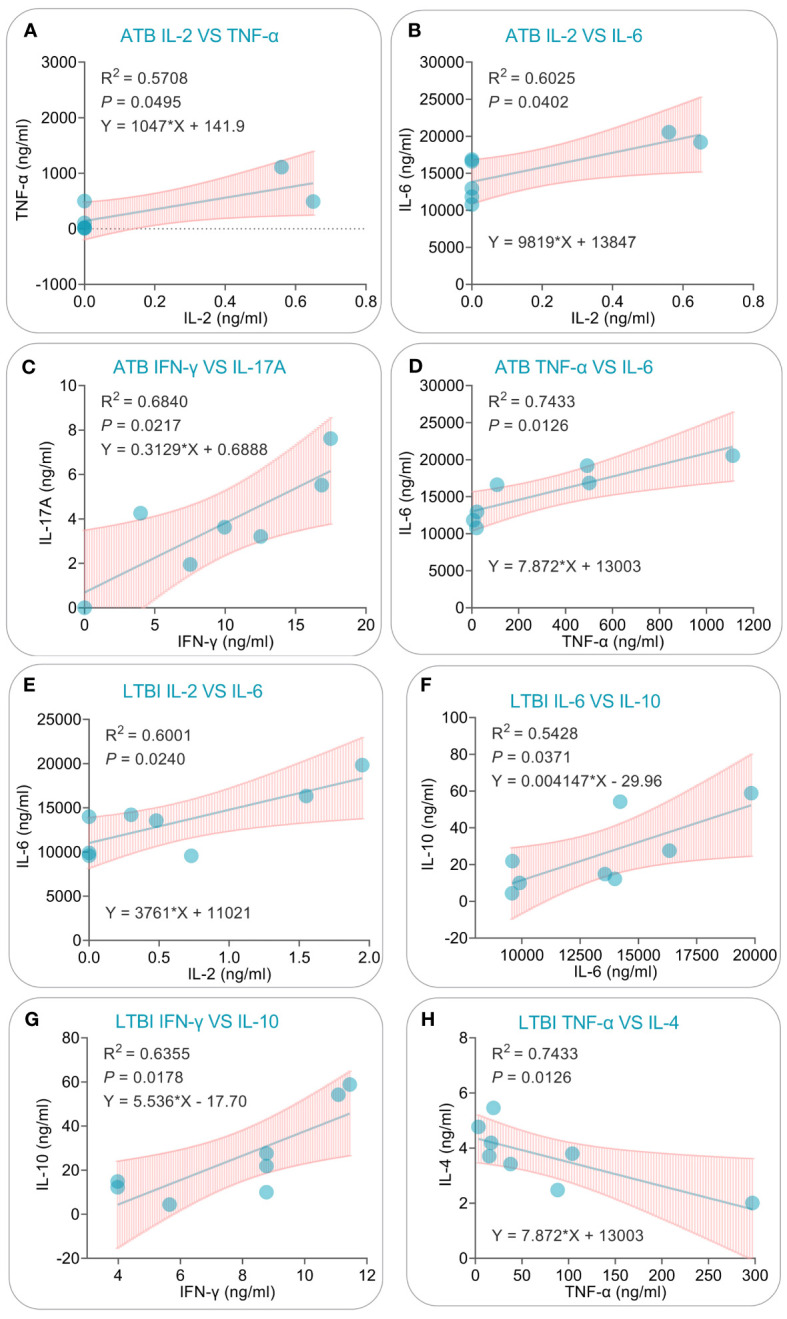
Figure 12.

Simple linear regression analysis of cytokines induced by the PP13138R vaccine in ATB patients and individuals with LTBI. The simple linear regression was conducted to evaluate the potential correlations for IL-2 vs. TNF-α (A), IL-2 vs. IL-6 (B), IFN-γ vs. IL-17A (C), TNF-α vs. IL-6 (D) in ATB patients, and IL-2 vs. IL-6 (E), IL-6 vs. IL-10 (F), IFN-γ vs. IL-10 (G), and TNF-α vs. IL-4 (H) in individuals with LTBI using the GraphPad Prism 9.5.1 software. The R-squared value, P value, and equation were displayed in each panel. P<0.05 is considered significant.
