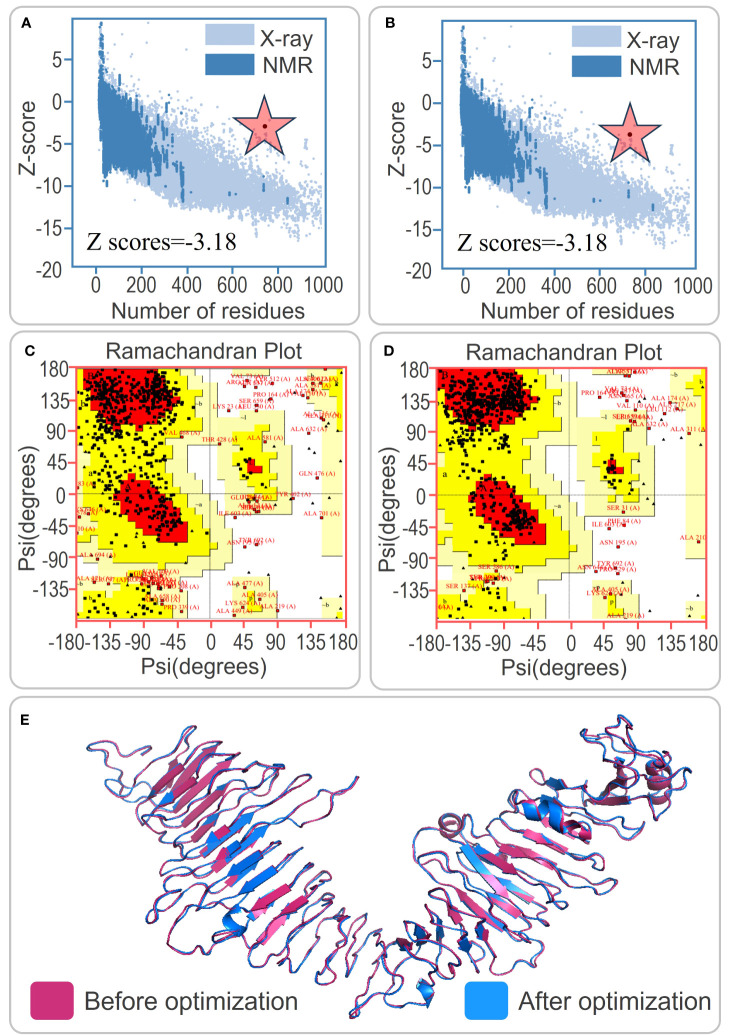
Figure 2.
Tertiary structure prediction and optimization of the PP13138R vaccine. (A) and (B) Z score analysis of the tertiary structure prediction of the PP13138R vaccine before and after optimization. (C) and (D) Ramachandran plot analysis showing the ratio of core, allow, gener, and disall in the tertiary structure of the PP13138R vaccine before and after optimization. (E) Schematic representation of the tertiary structure predicted by the I-TASSER server in pink, and optimized by the Galaxy Refine server in blue. The tertiary structure of the PP13138R vaccine is shown before and after optimization to improve stability and binding ability. The color scheme of the structure indicates the pre-optimized model in pink and the post-optimized model in blue. The Z score and Ramachandran plot analyses demonstrate that the optimized PP13138R vaccine has improved quality compared to the pre-optimized structure. The red star is the z-score.

