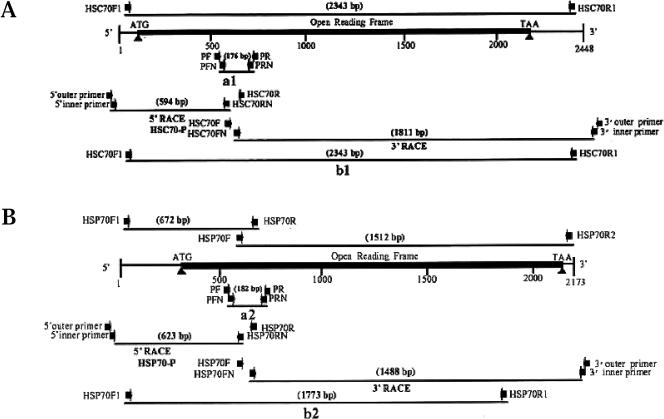
Fig 1.
Schematic diagram of Mar-HSC70 (A) and Mar-HSP70 (B) complementary deoxyribonucleic acids (cDNAs) showing locations of primers for polymerase chain reaction (PCR) and strategy of the gene cloning. Arrowheads represent primers, and lines under them indicate cDNA fragments amplified with the primers by PCR, 5′–rapid amplification of cDNA ends (RACE), and 3′-RACE

