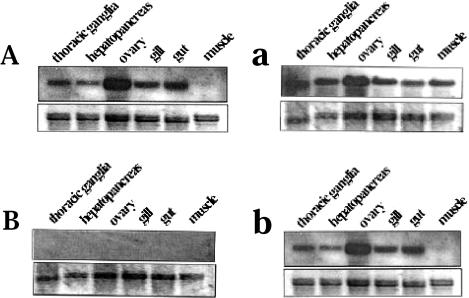
Fig 6.
Northern blot analyses of tissue-specific expression of Mar-HSC70 (A) and Mar-HSP70 (B) genes. Total RNAs (10 μg) extracted from thoracic ganglia, hepatopancreas, ovary, gill, gut, and muscle at different temperatures (25°C, A and B; 35°C, a and b) were analyzed. Both gene transcripts genes were detected by hybridization to a 594-bp and 623-bp 5′–untranslated region (UTR) fragment produced by 5′–rapid amplification of cDNA ends (RACE) for Mar-HSC70 and Mar-HSP70, respectively. The ethidium bromide–stained 28S/18S rRNA bands were used as a controls for loading variation. The figure was prepared from X-ray film using an HP 3500c Scanjet

