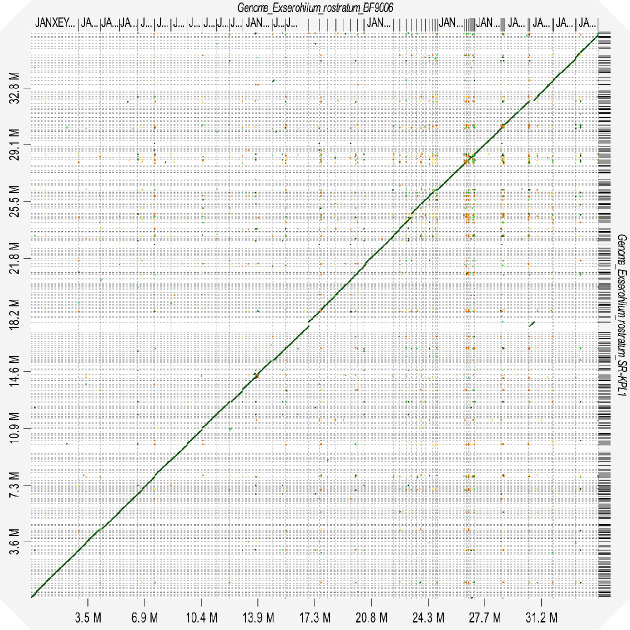
Fig 1.
Dot plot analysis for genome comparison of E. rostratum strains BF9006 and SR-KPL1 using D-GENIES (13). BF9006 as a target is on the x-axis, and SR-KPL1 as a query is on the y-axis. Genomic alignment regions are presented as four-colored lines, corresponding to different similarity values (Yellow: <25% similarity, Orange: 25–50% similarity, Green: 50–75% similarity, and Dark Green: >75%). The long stretches of dark green lines in the diagonal indicate high nucleotide similarity between the two strains of E. rostratum.

