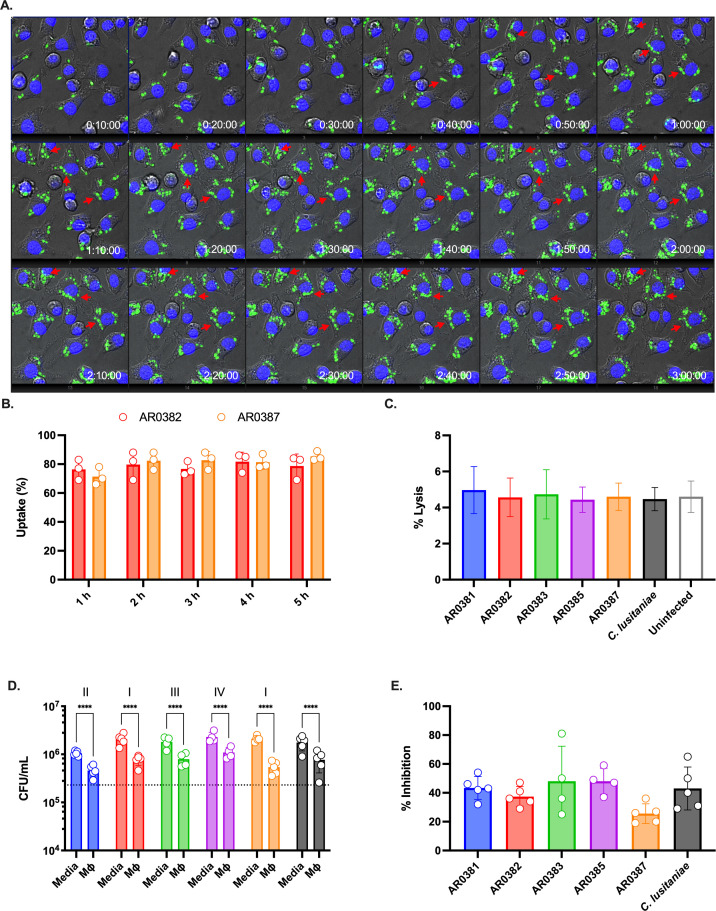
Fig 1.
Macrophages phagocytose and constraint C. auris survival. (A) J774A.1 macrophages were loaded with Hoechst 33342 and infected with GFP-labeled C. auris (AR0382), MOI 5. Time lapse was performed for 3 h. The red arrows point to examples of C. auris cells dividing inside the macrophage. (B) Percentage of macrophages with at least one engulfed C. auris cell. GFP-labeled C. auris strains (AR0382 and AR0387) were used to infect Hoechst-labeled macrophages. Time lapse was performed for 5 h and quantified at indicated time points; n = 3, mean and standard deviation. (C) Macrophage damage was determined by measuring the lactate dehydrogenase (LDH) activity in the supernatant after infection with C. auris for 5 h. A control with the less pathogenic C. lusitaniae was included for comparison. A negative control where macrophages were not infected was also included. Maximal LDH activity was determined in detergent-lysed control, set as 100%; n = 3, mean and standard deviation. (D) Colony-forming units were determined after infecting J774A.1 macrophages for 5 h. As controls, C. auris was inoculated in media-only to assess replication in the absence of phagocytes. Dotted line indicates the average initial CFU count (2.3 × 10⁷ CFU/mL); n = 5, mean and standard deviation. Data were analyzed with two-way ANOVA with Šidák’s multiple comparison test to determine statistically significant differences (P < 0.05). (E) The average CFU count of C. auris co-cultured with macrophages for 5 h relative to media-only controls (defined as 100%).

