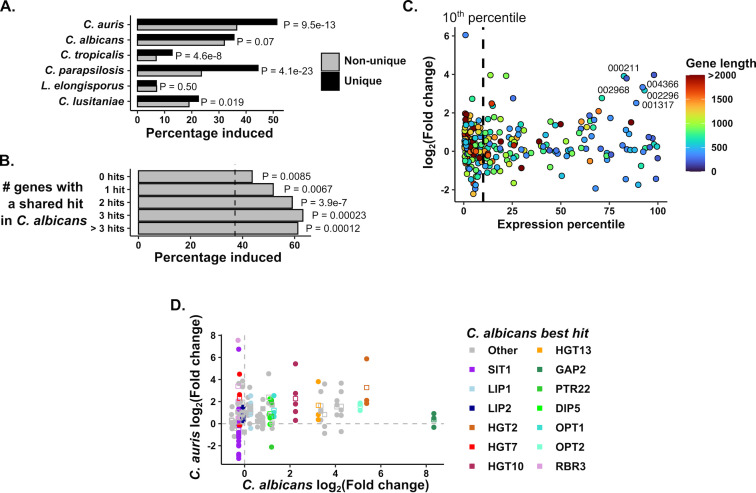
Fig 3.
C. auris-specific and expanded gene families are induced in response to phagocytosis. (A) C. auris-specific genes are especially enriched for phagocytosis-induced genes. For each species, genes specific to that species were identified (i.e., those without orthologs in any of the five other species compared here) and the percentage of species-specific genes induced by phagocytosis was compared to that of shared genes. P values were calculated by hypergeometric test. (B) C. auris-specific genes were categorized based on whether they had a BLAST hit in C. albicans and if they did, how many C. auris genes shared that hit (those genes without a C. albicans hit are labeled “0 hits”). The percentage of induced genes in each group is shown, with the vertical dashed line representing the percentage induced among all C. auris genes. By hypergeometric test, each class of genes was significantly enriched for induced genes. (C) Response of C. auris genes without a C. albicans BLAST hit as a function of Expression level and gene length. Expression percentile was calculated from the length-corrected mean expression level. Note that most genes in this category are in the bottom 10% of expressed genes (vertical dashed line). Colors indicate gene length, and genes that are at least 300 bp in length with strong average expression and induction are labeled (“B9J08_” suffixes have been removed from gene IDs, see Table S2 for more information). (D) Comparison of C. auris and C. albicans transcriptional responses in genes with evidence of C. auris expansion. For all genes whose best BLAST hit mapped to the same C. albicans gene as at least two other genes, the log2-fold change is compared to that of the C. albicans sequence homolog. Points indicate individual genes, squares the mean expression for that family. Genes highlighted are labeled by the C. albicans gene name directly above the points. Dashed lines mark a log2-fold change of zero in either species.

