Figure 3.
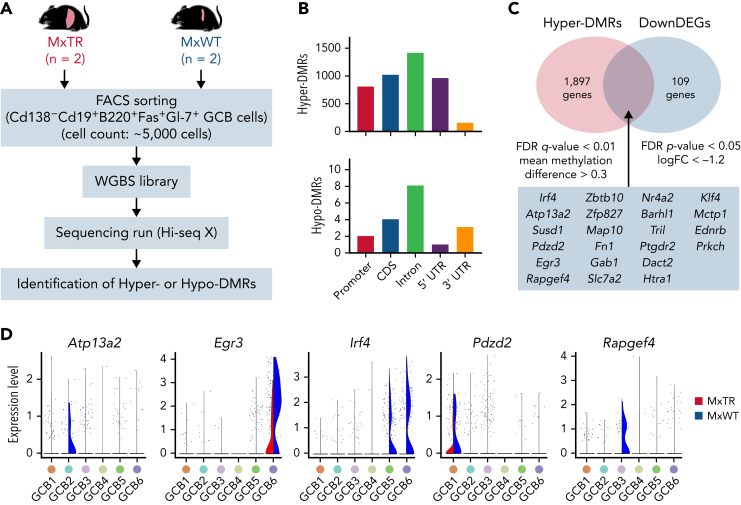
WGBS for GCB cells sorted from tumor-bearing MxTR and MxWT. (A) Overview of WGBS for GCB cells in the spleen from tumor-bearing MxTR (n = 2) and MxWT (n = 2) mice. FACS, fluorescence-activated cell sorting. (B) Distribution of hyper-DMRs (upper) and hypo-DMRs (bottom) in promoter, CDS, intron, 5′ UTR, and 3′ UTR. CDS, coding sequence. (C) Venn diagrams of hyper-DMRs from WGBS and downregulated DEG (DownDEGs)from corresponding RNA-seq analyses described in supplemental Figure 7. Cutoff: false discovery rate(FDR) q-value < 0.01, mean methylation difference > 0.3 (hyper-DMRs); FDR P-value < .05, logFC < −1.2 (DownDEGs). (D) Violin plots of 5 genes (Atp13a2, Egr3, Irf4, Pdzd2, and Rapgef4) downregulated in the GCB1 to 6 clusters of MxTR.

