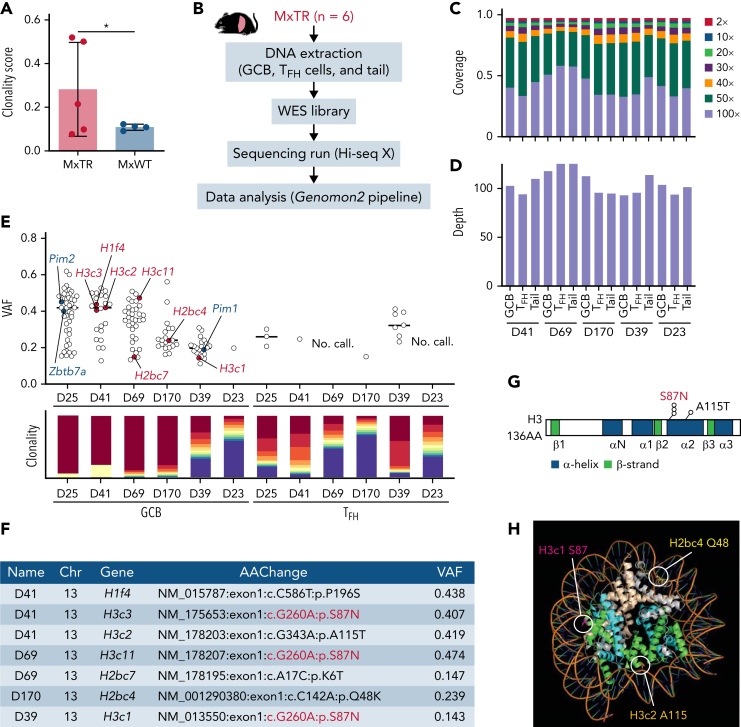
Figure 4.
GCB cells clonally expand in the microenvironment of TFH-like lymphomas. (A) Clonality score of genes in RNA-seq data from GCB cells. ∗P value < .05. (B) Overview of whole-exome sequencing (WES) for GCB, TFH cells in the spleen, and tail from MxTR (n = 6). (C) The percentage of targeted bases covered by at least 2×, 10×, 20×, 30×, 40×, 50×, and 100× sequencing reads and (D) average read depth by WES are shown for 5 paired samples from GCB, TFH cells, and tail. (E) Variant allele frequencies (VAFs) of mutations detected using WES (upper). Red, mutations in histone genes; blue, mutations equivalent to those of human DLBCL. Rearrangements of immunoglobulin heavy locus genes or T-cell receptor genes identified in WES data from each sample of sorted GCB or TFH cells, respectively (lower). Each of the top 10 sequences is represented using a different color (red to blue), and the less frequent clones are represented in violet. (F) List of mutations in histone genes in GCB cells. Chr, chromosome; AAChange, amino acid change. (G) Positions of somatic mutations in histone 3 (H3). AA, amino acid. (H) Crystal structure of the nucleosome core particle containing 8 histone proteins and double-stranded DNA, modified from PDB ID: 1U35 by the PyMOL program (Schrödinger). Orthologous positions of 3 mutants discovered in GCB cells from MxTR are highlighted (Q48 in Hb2bc, S87 in H3c1, and A115 in H3c2). The DNA strands are colored orange; gray, H2a; light brown, H2b; green, H3; and light blue, H4.

