Figure 5.
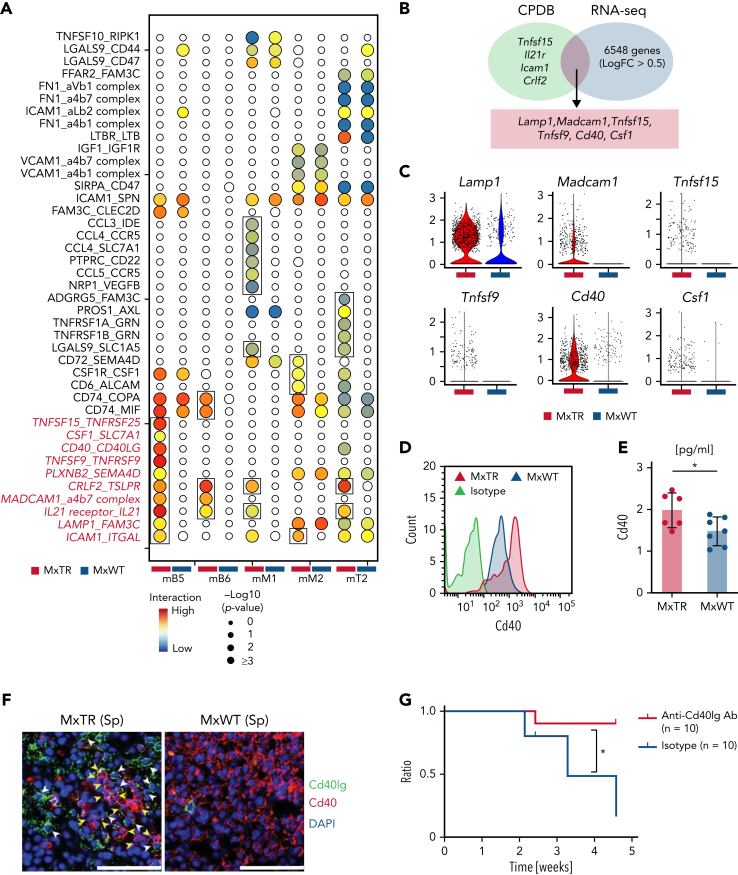
Identification and functional analysis of significant ligand–receptor pairs potentially underlying GCB/TFH tumor cell cluster interactions. (A) Interactome landscape across immune and TFH tumor cell clusters. Circle size indicates a negative log10 of the adjusted P value. Circles are colored only in subclusters with a significant P value. Significant interactions observed only in the MxTR are indicated by squares. (B) Venn diagrams of significant markers in MxTR between mB5 and mT6 (green) and markers upregulated in GCB cells of MxTR (blue) data. CPDB, CellPhoneDB. (C) Violin plots of 6 markers shared by CPDB and RNA-seq. (D) Histograms showing cell surface Cd40 expression in GCB cells. (E) Bar plots of Cd40 concentrations in serum. ∗P value < .05. (F) Immunofluorescence staining of spleen tissue. Green, Cd40lg (white arrowheads); red, Cd40 (yellow arrowheads); and blue, DAPI. Scale bars, 50 μm. (G) Survival curves for anti-Cd40lg antibody or isotype-treated mice. Anti-Cd40lg antibody-treated mice, n = 10; isotype-treated mice, n = 10. Ab, antibody. ∗P value < .05.

