Figure 7.
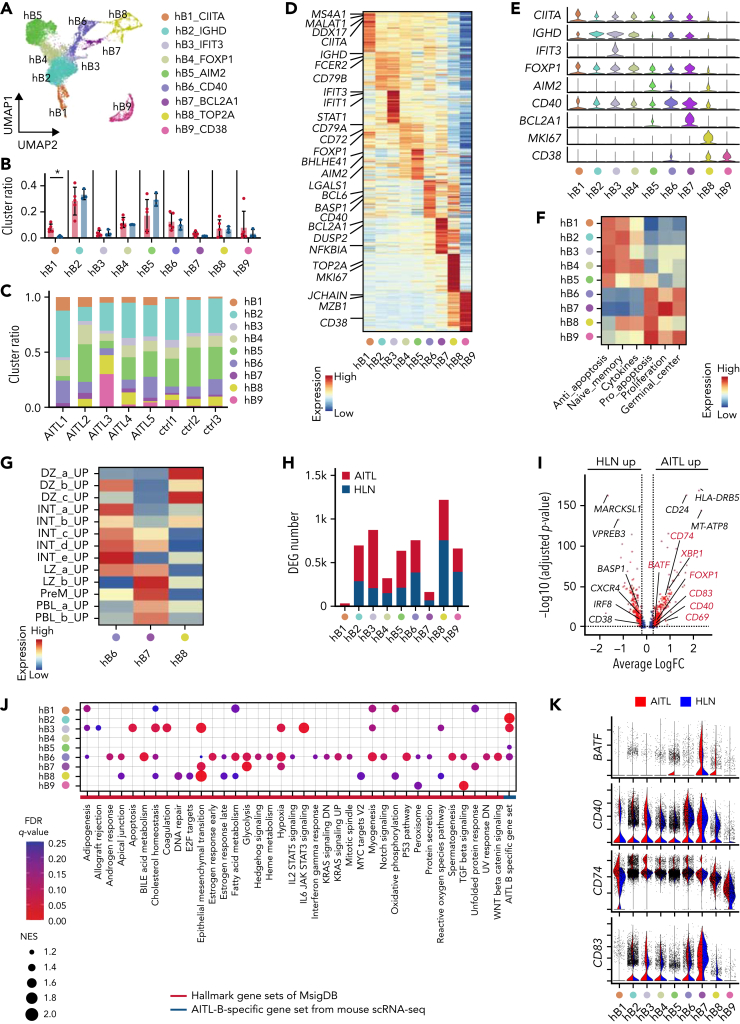
Human AITL samples exhibit intratumoral B cells phenotypically similar to mouse GCB cells. (A) UMAP plot of B-cell subclusters sorted in silico after integrating scRNA-seq data of AIT L and HLN samples. Nine subclusters were labeled with different colors. (B) Bar plots indicating percentages of each cluster. (C) Bar graphs indicating the percentage of each cluster in indicated samples. (D) Heatmap of the top 50 conserved markers of each cluster in (A). (E) Stacked violin plots showing specific conserved markers expressed in each cluster. (F) Heatmap showing pathways differentially enriched at each B-cell cluster (hB1 to 9) based on GSVA with B-lineage-related genes from Chung and colleagues. Gene sets are listed in supplemental Table 8. (G) Heatmap showing pathways differentially enriched in hB6 to 8 based on GSVA with GCB-cell–associated genes, from Holmes and colleagues. Gene sets are listed in supplemental Table 8. (H) Bar graphs showing the number of DEGs in the AIT L or HLN samples. (I) Volcano plot of DEGs in hB6. Genes in red are included among AIT L-B–specific gene set. (J) Dot plots showing pathways upregulated in hB1 to 9 of AIT L by GSEA with hallmark and AIT L-B–specific gene sets. Dot size indicates the normalized enrichment score (NES). Cutoff, FDR q-value <0.25. (K) Violin plots of genes included in the AIT L-B–specific gene set.

