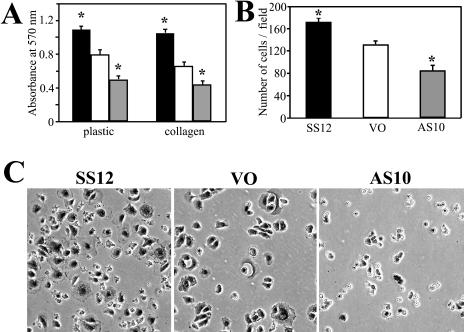
Fig 4.
Cell adhesion 1 hour after plating. (A) Cells attached to uncoated (plastic) or collagen-coated dishes (collagen) were quantified by staining with crystal violet. Black, white, and gray columns represent SS12, VO, and AS10 cells, respectively. Error bars represent standard error of the mean (SEM). *, P < 0.05 vs VO by Student's t-test. (B) The average number of cells adhered to collagen-coated dishes per 200× field was determined by counting cells attached 1 hour after plating. Error bars represent SEM. *, P < 0.05 vs VO by Student's t-test. (C) Morphology of each line 1 hour after being plated on collagen-coated dishes. Note that attached AS10 cells did not spread as well as VO or SS12 cells

