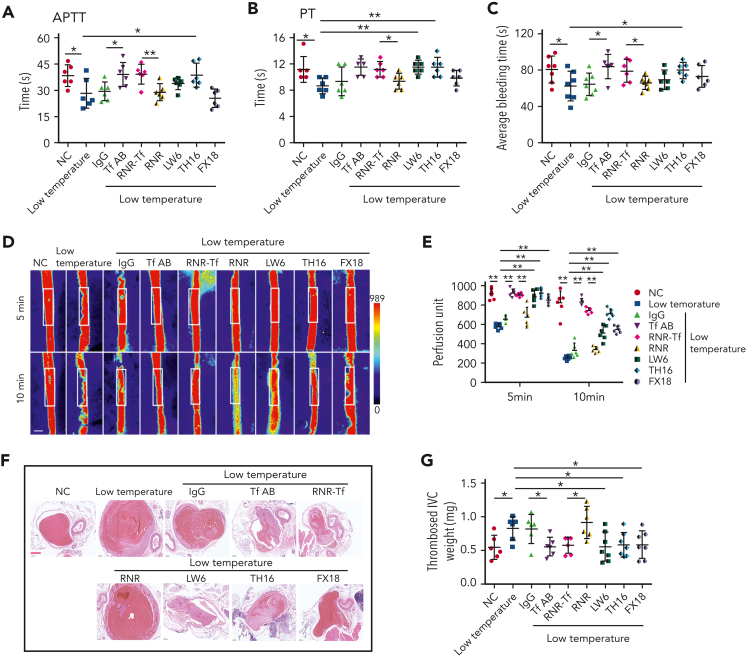
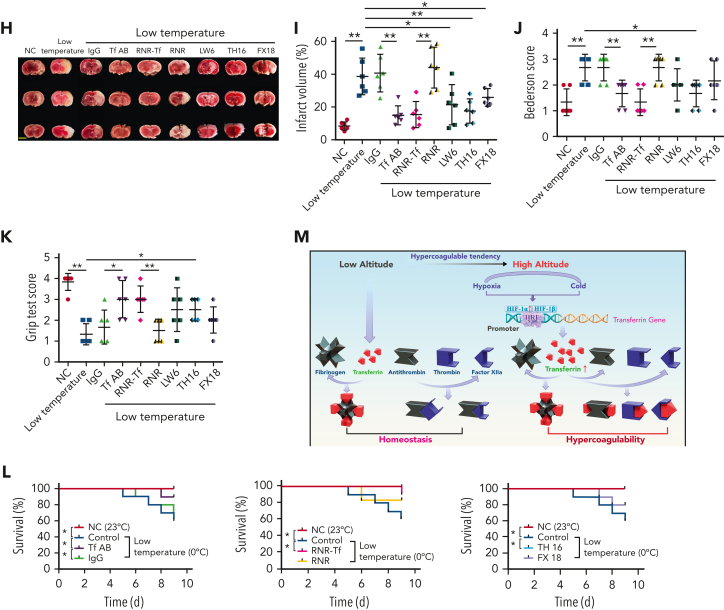
Figure 5.
Low temperature–induced hypercoagulability and thrombosis aggravation, which were reversed by transferrin knockdown and functional interference. (A-C) APTT (A), PT (B), and bleeding time (C) in mice are shown (n = 6-7). (D-E) Representative images of carotid artery blood flow in FeCl3-treated mice by laser speckle perfusion imaging (D), with region of interest (rectangle in white) placed in carotid artery to quantify blood flow change (E) (n = 6). Color bar at bottom indicates perfusion unit scale (0-989); scale bar represents 1 mm. Mice were subject to IVC stenosis for 24 hours to evaluate venous thrombogenesis. (F-G) The pathological changes were observed through hematoxylin and eosin staining (F) and calculating thrombus weight (G) (n = 6-7); scale bar represents 200 μm. (H-I) Representative images of TTC-stained coronal brain sections (H) and quantitative analysis of stained area (I) on day 1 after tMCAO. Ischemic infarctions appear white, and brain infarct volumes were measured by planimetry (percentage of whole volume). (J-K) Bederson (J) and grip-test (K) scores were also measured (n = 6). (L) Survival rate of mice in anti-Tf-AB–, RNR-Tf–, RNR virus–, and TH16- and FX18-peptide–treated groups under low temperature (n = 20). (M) Graphical representation of iron and O2 replenishment at high altitude, contributing to thromboembolic disorders. Detrimental environmental factors (hypoxia and low temperature) and high altitude–induced iron deficiency increased HIF-1α levels, which upregulated transferrin to increase iron transport to compensate for erythropoiesis and O2 supply. Simultaneously, abnormally upregulated transferrin caused hypercoagulability by interacting with multiple plasma proteins to potentiate thrombin and FXIIa and inhibit antithrombin. Animal experiments were repeated 3 times, independently. Data represent mean ± SD. Each point represents 1 mouse. Panels A-C, E, G, and I-K, ∗P < .05, ∗∗P < .01 by unpaired t test to compare; for example, Tf-AB and IgG groups or RNR-Tf and RNR groups. Panel L, ∗P < .05 by log-rank test to compare; for example, Tf-AB and IgG groups or RNR-Tf and RNR groups.


