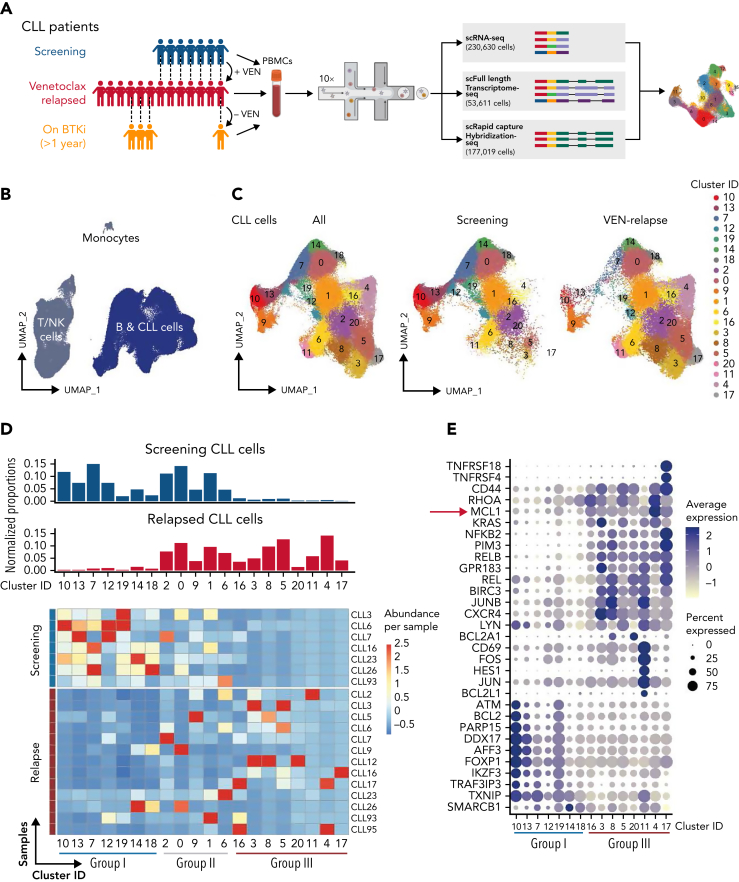
Figure 1.
Single-cell multiomics reveals altered gene expression upon acquisition of VEN resistance. (A) Schematic of single-cell multiomics approach. The details of the patients are provided in supplemental Figure 1A-B. Samples taken at different time points from the same patient are connected with dotted lines. (B) UMAP projection of PBMCs (n = 230 360 cells) collected from patients or healthy donors (control samples). (C) UMAP projection specifically of the CLL cells (n = 161 499 cells) collected from patients at screening or after VEN relapse. (D) Upper: bar graphs of normalized proportions of all screening (blue) or relapsed (red) CLL cells from each cluster. Lower: heatmap portrays the abundance of CLL cells per sample (rows) in individual clusters (columns). Blue line: clusters predominantly represented in screening samples (“Group I”); red line: clusters representative of relapsed samples (“Group III”). (E) Dot plots showing a curated list of marker genes unique to the Group I screening-representative clusters or Group III relapse-representative clusters. Color intensity reflects the relative degree of gene expression and the size of the dot indicates the fraction of cells expressing that gene in that cluster, as exemplified by the higher expression of MCL1 present in more cells of the Group III clusters.

