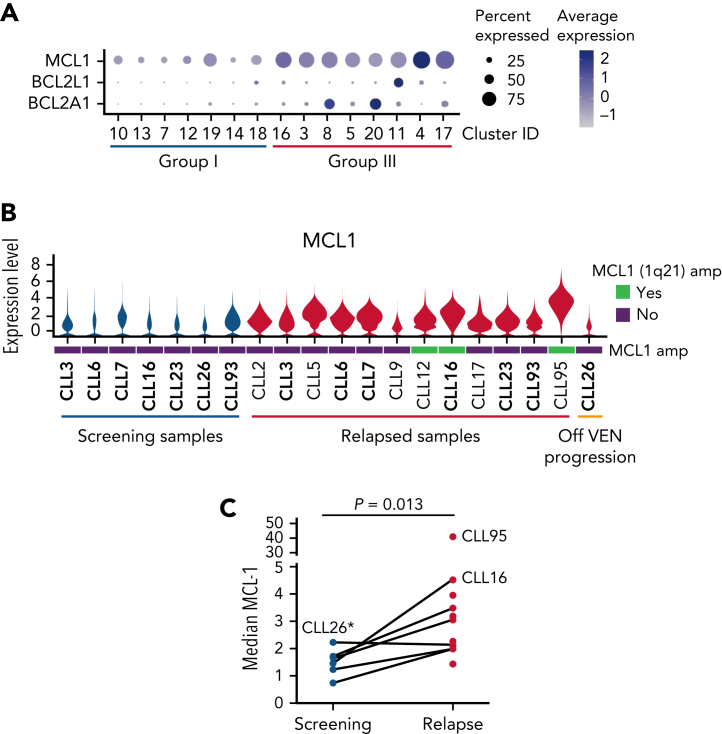
Figure 2.
VEN-resistant cells display altered survival signaling. (A) Dot plots showing relative expression of prosurvival genes across Group I (predominantly cells from screening samples) and Group III (predominantly VEN-relapsed samples) clusters. (B) Violin plots showing MCL1 expression across the individual patient samples, including 3 with 1q21 (MCL1) amplification (marked as green bars). The height of the violins indicates the relative degree of MCL1 gene expression, and the width indicates the proportion of cells in a sample with increased MCL1 expression. (C) Mass cytometric analysis of MCL1 protein expression in viable (cisplatinlo) CD5+veCD19+ve CLL cells among PBMCs from screening (blue, n = 6) or relapsed samples (red, n = 11). The median expression for each sample was calculated by FlowJo. P value is from a 2-sided paired t test. Paired patient samples are joined by dotted lines. ∗Patient (CLL26) relapsed while off VEN.

